Sunday 23 November 2014

Do QE4 already started in U.S.?

welcome,

Barely ended QE3 program, and now we have a new stimulus in the form of cheaper by more than 31% of the price of crude oil. If the U.S. consumes daily average of about 18 million barrels every day Americans save more than $ 630 million. During the year, giving it a gigantic relief for the economy, the amount of $ 230 billion, which is about 1.3% of GDP.

So why endlessly print money, if you can knock down the price of raw materials such as oil, copper, silver or gas to a similar or even greater extent to help the economy? Do not be afraid of deflation absolutely, because she is never in itself a problem - it is a cure, not a disease. The disease is excessive inflation and increasing prices of all kinds of assets on the basis of "finding a greater fool". 

regards,
oscarjp 

More conclusions about the Minutes

hello,

A factor that contributed to the weakening of the dollar after the release of the FOMC minutes was the record of the discussion of falling inflation expectations. Members of the Committee drew attention to this factor twice and discussed deeply the cause of this turn of events:


Part of a more hawkish members tried to explain changes in the prices of inflation-protected bonds (securities shall reflect market inflation expectations) the low liquidity and other "special factors". So in a sense trying to ignore what carries overtones valuation of these securities:


Course, there was a reference to the improvement of the situation on the labor market, although some pigeons members drew attention to the fact that many of the newly employed, are employed on a casual and non-traditional full-time jobs:


At the end, some members suggested that for the time being "loosely" ideas predictions based on consensus forecasts in addition to the Committee, which was to improve the communication of the bank. This topic will be discussed at the next meeting of the FOMC.


In summary publication of the minutes at a slightly hawkish expectations after the meeting Minutes brought slightly surprising turn in the direction of reflection on inflation expectations (especially those markets). Hence, in the first moment the market reacted repricing of the dollar. However, the surprise was not significant enough to sell to investors began looking forward to its weakening dollar in the long run.


regards,
oscarjp

Thursday 16 October 2014

I have closed my position on SP500

hello,

For variety, I will begin today from the chart and link of my trade.
 
chart 1. futures SP500 Index, Daily, 2014-10-16


Today I decided to to close my position on the SP500. According to me the potential for further falls is already very limited. In addition, the wave system also shows the possibility of the end of correction. So my profit from the transaction amounted +172 points.

Published in yesterday's Beige Book did not bring anything new. Accordingly, the publication does not have a major impact on the markets. This time the publication prepared by the Fed from Minneapolis.

Within a few weeks of falls in the stock market and already some members of the Fed come before a range and decide to comment on the situation on the capital market, which is not their duty. Definitely in my opinion, should focus on monetary policy. But unfortunately, the truth is that talking is what employers they force them to.

Fisher Head of the FED from Dallas gave a television interview in which he said, among other things, that:
  • Correction in the stock market does not mean that the economy is in trouble;
  •  It is too early to consider introducing the next QE program.
From among the many hypotheses trying to explain yesterday's big moves on Wall Street and in the debt market in the United States most likely would appear to be associated with the liquidation of large positions by large hedge funds that have suffered huge losses yesterday following the news that most likely there will be no merger of the two giants of health sector - Shire and AbbVie.

Hedgefunds (fund headed by John Paulson) has long been buying huge quantities of shares in Shire, in the hope of just that one of the American pharmaceutical giants take over the Irish company in connection with the powerful tax benefits that such a solution could bring. In fact, the share Shire found himself willing - giant biopharmaceutical Chicago - AbbVie. The merger of companies has gained acceptance from the board of the Shire, and the voting shareholders had come in the coming weeks. Generally, everyone was happy. However, at this time appeared ... the government.

People in Washington seeing a rash of mergers in the so-called. tax inversion decided to disrupt the businesses fleeing from paying taxes in the United States and change the law. That's why yesterday AbbVie received information that the merger may not occur. Shire Shares in London were thrown down by as much as 28%. Hedge funds have suffered strong losses, and here comes the connection with yesterday's price reduction on Wall Street and the movements in the debt market.

According to. various unofficial reports, hedge funds as a result of massive losses on shares of Shire have to close other items. These were primarily long positions in shares of other companies in the United States (hence the strong depreciation on Wall Street) and short positions in American bonds (hence the strong increase in prices and a drop in yields on 10Y to 1.86% at one point).

But, fortunately it's just my scenario. :)

regards,
oscarjp

Tuesday 14 October 2014

S&P down and I make money +132 profit

welcome,

Do you remember my entry from September 4 regarding the recommendation, a short position on the S&P 500 Index ?

For the record, below I attach a link to this recommendation.


chart 1. futures SP500 Index, Daily, 2014-09-04

I have placed above chart looked like then, and how it looks now.

chart 2. futures SP500 Index, Daily, 2014-10-14

To summarize the current gain is about 132 points profit.


regards,
oscarjp

Monday 13 October 2014

On Wednesday, next auction of milk

welcome,

Auctions milk powder in New Zealand are a very important event from the perspective of the New Zealand dollar what we have seen repeatedly. Prices of milk powder are of great importance for the economy in New Zealand. Dairy products, mainly milk powder makes up 21% of total exports of New Zealand, in general, most of the exports of the country is focused on products derived from agriculture and forestry. At the end of 2013 and the first half of 2014 years strong demand for the goods from China has caused price increases. Fonterra also significantly increased the first forecasts, then the guaranteed purchase price. For 2014 amounts to 8.3 NZD per kg, while the current forecast (already repeatedly lowered) at the turn of 2014/2015 returned to the level of 5.3 NZD / kg.

At the last auction price index of milk powder fell by -7.3%. If at Wednesday's auction price drop has reached a similar size, it is very possible that it would be a factor to further sell the New Zealand currency. In turn, higher prices can positively surprise investors, and this may lead to a growth rebound and continuation of the current correction.

regards,
oscarjp


The information contained in this publication is not intended as an offer or solicitation for the purchase or sale of any financial instrument. Any opinion offered herein reflects oscarjp-chrimatistikos current judgment and may change without notice. Users acknowledge and agree to the fact that, by its very nature, any investment in shares, stock options and similar and assimilated products is characterised by a certain degree of uncertainty and that, consequently, any investment of this nature involves risks for which the user is solely responsible and liable.

Wednesday 8 October 2014

Worldwide Investment Fund Assets and Flows

hello All,

Investment fund assets worldwide increased 5.2 percent during the second quarter to stand at EUR 25.65 trillion at end June 2014. In U.S. dollar terms, worldwide investment fund assets totaled US$ 35.03 trillion at end June 2014.

Worldwide net cash inflows decreased in the second quarter from EUR 292 billion to EUR 252 billion.  This decrease can be attributed to a turnaround in net flows of money market funds during the quarter.

Long-term funds (all funds excluding money market funds) registered net inflows of EUR 301 billion, up from EUR 271 billion in the previous quarter. Worldwide bond funds enjoyed increased net inflows of EUR 112 billion, up from EUR 69 billion in the first quarter. In contrast equity funds experienced decreased net inflows of EUR 48 billion, down from EUR 92 billion in the previous quarter. Balanced funds also registered a rise in net sales to EUR 81 billion, compared to EUR 71 billion in the first quarter.

Money market funds registered a turnaround in net flows to post net outflows of EUR 49 billion, compared to net inflows of EUR 21 billion in the first quarter.  The global outflow from money market funds in the second quarter was driven by outflows of EUR 52 billion in the United States and EUR 22 billion in Europe.

At the end of the second quarter, assets of equity funds represented 40 percent and bond funds represented 22 percent of all investment fund assets worldwide. The asset share of money market funds was 13 percent and the asset share of balanced/mixed funds was 12 percent. 

The market share of the ten largest countries/regions in the world market were the United States (49.6%), Europe (29.1%), Australia (5.1%), Brazil (4.9%), Canada (3.8%), Japan (3.2%), China (1.6%), Rep. of Korea (0.9%), South Africa (0.5%) and India (0.4%).

Table 1. Total net assets 2009-2014 Q2, 2014-10-08
Table 2. Total net assets of the European Investment Industry, 2014-10-08

regards,
oscarjp

Wednesday 24 September 2014

Problems with TLTRO, what next? QE=ABS+Gov.Bonds?

Hi,

In June this year, the European Central Bank has taken a range of measures aimed at reinvigorating the European economy, in response to declining inflation and negligible economic growth. One of the tools used was the introduction of a program known as TLTRO, whose target expected to be approx. nearly 400 billion euros, and the program should be directed to the recovery in lending in the Eurozone, and thus have a positive impact on the real economy.

I'll start with the following graphic showing who and how much borrowed during the auction TLTRO:

graph 1. September TLTRO Take-up

What's this TLTRO ?
  • Long-term loans to commercial bank;
  • Value of the program ultimately is expected to be approx. 400 billion EUR;
  • Loans will be taken in September 2018;
  • The value of loans to individual banks, will be determined from the increase in the value of each bank consumer lending;
  • In the event that the banks did not increase lending, will have to repay the loan earlier;
  • The interest rate of new loans for the TLTRO will be constant and will reach MRO of the start date of the loan plus 10 basis points. margin;
  • Each bank will be able to borrow a value not exceeding 7% of its total lending as of 30 April 2014. (In the amount of credit will not be counted for the financial sector loans and mortgages);
  • As part of the loan gets even restrictions that make loans to hit the real economy sector.
     
Published last week, data relating to the first allocation of loans TLTRO disappointing showing by the way, that the problem in the euro area is much more serious and is not limited to a temporary lack of liquidity in the banking sector.

According to economists, the main problem of European Eurozone is low demand for loans in the economy, which is reflected in the effectiveness of the programs implemented by the ECB. In the first tranche only TLTRO banks took 82.6 billion, plus economists interviewed by Reuters predict that in December, the second tranche is expected to be 175 billion euros. Summing up the two tranches, we can see that the 400 billion euros by the ECB offered nearly 30% of the amount will not be used. To not be limited only to the current data, it is worth comparing it with the programs introduced during the acute phase of the crisis in the euro zone, which resulted absorbed by the banking sector over one trillion (!) Euros.

European Central Bank is slowly beginning to end with the tools that it could affect the real economy. In the words of Mario Draghi interest rates in the euro area have already reached the lower limit and it is technically impossible to make them even lower. This gives banks a clear message - use and lend, because they will not be cheaper. The problem is that these actions are connected with others, introduced by the ECB at the same time, which can cause some indecision in the market and reduce their effectiveness. Loans targeted at the private sector falling for nearly two years, and since the introduction in June TLTRO improvement in this sector practically does not occur.

In summary, the actions of the ECB in recent months have led to increases in the stock market and the weakening of the European currency, but had little impact on the real economy, which inhibits the growth of both inflation and economic growth will faint. Because of this, the ECB may be forced to take further decisions, for example. Introduction of a broader QE in the form of buying government bonds, but the impact of such measures on the real economy would be even smaller than TLTRO program. In addition, it would delay fiscal reforms in the euro area, due to the lower costs of debt issuance, which are strongly opposed to Germany.

Mario Draghi will give an interview today.

After his words, it can be concluded that the European economy is doing so badly that significantly increased the likelihood of extension of the program buying ABS, additionally on government bonds.


regards,
oscarjp

Monday 22 September 2014

note the dot-chart !

hello,

Today I want to focus on a very important aspect when making investment decisions in the long term. Dot-chart, is a tool introduced by BB and is intended to serve greater transparency in the policy of the Fed and the fact it is the role perfectly. However, often the problem lies in the fact that a large number of observers do not want to see this chart.

Each member of the FOMC, marked by dots, at what level would see the main interest rate at the end of the next three years, and the so-called long (unspecified) period. All decisions are made assuming that the economy is balanced. Chart is published on a quarterly basis, after the meetings, after which we get to know a new economic projections and followed by a conference Yellen.

This chart is very important, it says (almost) everything, especially that Yellen gives the impression that he wants to represent not his views, and was a consensus within the Committee. Shows what is the attitude of all members and not just Ms. Yellen.

What should pay attention to?

chart 1. Target federal funds rate at year end published in June 2014

In June, the consensus assumed rate at 1 or 1.25% at the end of 2015, which meant 3 or 4 increases. The market did not yet priced in such a scenario, but Now it is - which brought just a clear strengthening of the dollar. Therefore, to dollar appreciated further, dots should more clearly focus on the level of 1.25%.

Consensus for 2016 years is less clear, but let's assume that on average it is 2.5%, ie the next 5 to 6 increases.

Indeed, short-term market rates in the United States are rising in anticipation of the first rise, making the dollar gains. However, at the same time, long-term interest falling. Even at the beginning of the year, freshly Open Market Committee decision to launch QE3 limit, yield on 10-year-olds exceeded 3%. In the spring it was 2.7%, and when the S&P500 came out above the 2000 pts., Less than 2.4%. It is a change that investors in the stock market very gladly accept: the lower long-term interest rates, the more future earnings are worth today. And yet the share price is nothing more than the discounted stream of future profits.

For comparison chart placed below the latest projections of the FOMC members from September this year. Compared to the previous graph we see all that strong tightening of monetary policy in the near future.
 
chart 2. Target federal funds rate at year end published in September 2014

regards,
oscarjp

Tuesday 16 September 2014

Goldman Sachs recommends buying U.S. stocks

hello All,

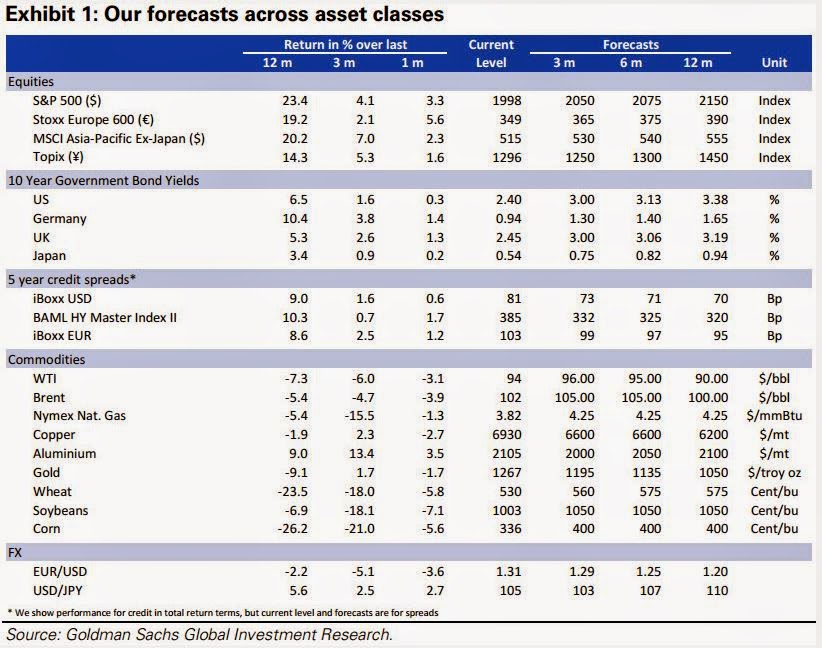
In today's entry I'm going to present the latest forecasts Goldman Sachs regarding the most interesting financial markets of the world.

In a recent report, Goldman recommends upgrading equities to overweight for the next 3 months, rolling index targets forward, and piling investors into high-yield credit.

"We upgrade equities to overweight over 3 months, in line with our 12-month view. We have rolled our index targets forward to higher levels for all regions except Japan and, following the dovish ECB decisions yesterday, we now see the risk to equities from higher bond yields as less imminent. We maintain a high conviction that yields will rise from here, but since our last GOAL, risks have clearly shifted in the direction of a slower path. Today we re-iterated our yield forecast for the US, UK and Japan and lowered our year-end Bund forecast from 1.60% to 1.30%"

table 1. Expected returns and recommended asset allocation

Goldman recommended asset allocation:

Equities: "We are overweight over both 3 and 12 months. We expect earnings growth, dividends, and high risk premia to support returns."

Commodities: "We are neutral over both 3 and 12 months but expect significant dispersion below the index level. We like nickel, palladium, zinc and aluminium, but see downside for copper and gold. Roll carry is likely to contribute significantly to returns, especially for oil, copper and aluminium."

Corporate credit: "We remain underweight over both 3 and 12 months. We expect spreads to narrow, but given already tight levels, rising government bond yields are likely to dominate the returns, especially for US IG credit. The exception is US HY, and within credit we would recommend an overweight in HY relative to IG."

Government bonds: "We remain underweight. We expect yields to rise due to sustained high US growth and accelerating inflation, a decline in deflation concerns in Europe, and support to inflation expectations from ECB policy action."
 
table 2. Goldman forecasts across asset classes

The assessment of the above recommendations will leave you to your own analysis.


regards,
oscarjp

 
The information contained in this publication is not intended as an offer or solicitation for the purchase or sale of any financial instrument. Any opinion offered herein reflects oscarjp-chrimatistikos current judgment and may change without notice. Users acknowledge and agree to the fact that, by its very nature, any investment in shares, stock options and similar and assimilated products is characterised by a certain degree of uncertainty and that, consequently, any investment of this nature involves risks for which the user is solely responsible and liable.

Thursday 11 September 2014

USD/CAD LONG

Hello,

Following the entry of the July 7 <link below> regarding the trend of the pair USD/CAD, today we go back to the main trend and the open LONG position.


The most optimistic target is 1.166 and of course do not forget about the stop loss order. I would suggest there are currently quite distant levels of 1.093

chart 1. USD/CAD 4H, 2014-09-11


A summary of all transactions will appear in the weekend. In addition, all my transactions posted on the blog you can find the tabs "SUMMARY" and "MY BLOGGING TRADING" on the right side.

regards,
oscarjp 


The information contained in this publication is not intended as an offer or solicitation for the purchase or sale of any financial instrument. Any opinion offered herein reflects oscarjp-chrimatistikos current judgment and may change without notice. Users acknowledge and agree to the fact that, by its very nature, any investment in shares, stock options and similar and assimilated products is characterised by a certain degree of uncertainty and that, consequently, any investment of this nature involves risks for which the user is solely responsible and liable.