Thursday 30 May 2013

Nikkei Plunges Another 5%

hello,

the last time in the media and on the Internet began to spend a lot of time for Asia, particularly Japan. So I decided to also take one entry describing the current situation on the Nikkei Index.

In the past few days we are watching the correction, but the upward movement may resemble the earlier movement, which we observed from April 2003 to July 2007, which lasted four years and three months.

The current trend started in March 2009 and if it take as much time as the previous move should be completed in June 2013.

However, this is only my own analysis and during the time when governments and central banks to intervene strongly on the markets in the entire financial history of the world. Each scenario is possible so you should always remember about SL.

Nikkei Index, W1

best regards,
oscarjp


The information contained in this publication is not intended as an offer or solicitation for the purchase or sale of any financial instrument. Any opinion offered herein reflects oscarjp-chrimatistikos current judgment and may change without notice. Users acknowledge and agree to the fact that, by its very nature, any investment in shares, stock options and similar and assimilated products is characterised by a certain degree of uncertainty and that, consequently, any investment of this nature involves risks for which the user is solely responsible and liable.

Monday 27 May 2013

correction signal on GBP / USD

On Wednesday, there were two strong signals the start of the correction on GBP / USD.

the first of which was an increase of volume in the important resistance which meant the appearance of "smart money" in the market - chart 1

and a second signal confirmed Elliott waves - chart 2


chart 1 - GBP/USD, H1


chart 2 - GBP/USD, H1

basic question now is - what formation in the correction we will draw and what will be price range.

If we look more broadly at the graph it can be assumed that this is just the first wave, and now creates a corrective wave number 2. After which there will be the best time to make money.

maximum range of correction it levels of 5380, but heavy resistance are also in 5310 (chart 3). At these price levels should pay attention to the volumen.


chart 3 - GBP/USD, H4


regards,
oscarjp


The information contained in this publication is not intended as an offer or solicitation for the purchase or sale of any financial instrument. Any opinion offered herein reflects oscarjp-chrimatistikos current judgment and may change without notice. Users acknowledge and agree to the fact that, by its very nature, any investment in shares, stock options and similar and assimilated products is characterised by a certain degree of uncertainty and that, consequently, any investment of this nature involves risks for which the user is solely responsible and liable.

Wednesday 22 May 2013

whether Goldman deceived their clients?

On April 18 GS recommended going short HUF/EUR.

GS wrote:

"Our view has been that higher US yields would hurt a number of EM currencies (including the HUF). We also thought that ongoing monetary easing in Hungary would further compress interest rate differentials, leading to a gradual weakening in the currency. Although both macro drivers materialized, the HUF strengthened, contrary to our expectation".

"We clearly underestimated the degree of risk premium for weaker economic outcomes already embedded in the currency. In the short life of the recommendation, a number of positive catalysts have emerged, including a strong GDP print and a smooth outcome in the ongoing budget negotiations with the EU".

"Our broader fundamental view has not changed, but having just hit our recommended stop of 290, we recommend closing the position with a potential 2.86% loss (including negative carry of about 32bp in total)".


chart 1, HUF/EUR

It is clear that a "big fish" was present on the market a few days earlier and completely cleaned the market. Then issued a reverse recommendation to increase his exposition.

Customers had to book a loss but the "big fish" has reached a profit without any risk. of course without SL.

Make a conclusions themselves.

regards, oscarjp


Tuesday 21 May 2013

"Good News Is Good For Equities, And Bad News Is Good For Equities"

Unfortunately, what we see on the SP500 chart shows that if a good or bad economic data still motivates the index goes up (the trend).

according to my analysis and my observations, I believe that at the moment the SP500 futures has reached its peak at 1674 points and now should begin to create a correction.

Reasons why I think so, at least a few.

1. The risk that the Fed will reduce the size of bond purchases (QE 1,2,3 ... etc.),
2. Negative divergence SP500 to Short Activity Z-Score (20 each cumulative short Activity Across Equity L / S Funds), (chart 1)
3. expanding spread between the SP500 and EBITDA, (chart 2)
4. testing relevant resistance on the chart, (my analysis - chart 3)
5. forecasts for growth by Goldman Sachs, (charts 4,5)


chart 1

chart 2

chart 3

chart 4

chart 5


regards, oscarjp


The information contained in this publication is not intended as an offer or solicitation for the purchase or sale of any financial instrument. Any opinion offered herein reflects oscarjp-chrimatistikos current judgment and may change without notice. Users acknowledge and agree to the fact that, by its very nature, any investment in shares, stock options and similar and assimilated products is characterised by a certain degree of uncertainty and that, consequently, any investment of this nature involves risks for which the user is solely responsible and liable.

Monday 20 May 2013

do not forget to pick up the SL

hi again,

Today's lows on gold fluctuated in the limit from 1342 to 1340 dollars per ounce. As it turned out it was the perfect level for the purchase of the contract about I wrote a few days ago.
A few minutes ago finished saying the Fed's Evans who said I quote:

"Fed could keep rates low even after unemployment falls below 6.5% if inflation remains low"

this statement has caused the average appreciation of the euro against the dollar and the strong appreciation of gold.

chart 1, Gold Daily

at 21:30 Polish time gold is traded at $ 1,392 an ounce. In that case, should increase the SL and be guaranteed a profit. Congratulations.

2 ways for polish contract futures

hello traders,

for a long time I began to spend more time analyzing Polish futures. This is a Index that from the beginning of the year continued a trend opposite to the SP500 and DAX.

I believe that the reluctance of foreign capital to invest in the Polish market comes from the lack of clear information from the government about the marginalization and limited cash inflows to the open pension funds performing the role of the second pillar of the pension.

Another drawback, which may discourage speculation in the futures contract is too low liquidity for them.

Nevertheless, I believe that it is worthwhile to focus on the analysis. Below you will find two scenarios where according my opinion more probable to realize the forecast is the first charts.

Of course, comments are welcome :)


chart 1, FWIG20 scenario 1


chart 2, FWIG20 scenario 2


as is clearly seen in the two scenarios, the chart for the next few days (weeks) will behave the same way. An important point where to decide which of the scenarios is correct is the level of 2500 points. Then puncture this level will open the way to new heights. If the market turn around and you should see new lows being the last leg of the correction "C".


best, oscarjp


The information contained in this publication is not intended as an offer or solicitation for the purchase or sale of any financial instrument. Any opinion offered herein reflects oscarjp-chrimatistikos current judgment and may change without notice. Users acknowledge and agree to the fact that, by its very nature, any investment in shares, stock options and similar and assimilated products is characterised by a certain degree of uncertainty and that, consequently, any investment of this nature involves risks for which the user is solely responsible and liable.

Friday 17 May 2013

what happens on gold

recently appeared on the Internet a lot of articles on the gold market. All these opinions indicate the weakness of gold, and the outflow of capital investors who no longer have to believe in growth. Bloomberg on its website published an article in which billionaire investor George Soros speaks quite negatively and warns against possible fall in prices.

link: http://www.bloomberg.com/news/2013-05-16/soros-leads-gold-stake-cuts-before-bear-market-drop.html

However, the daily chart on the futures contract in the gold market can observe an increase in volume. It was generated in April and at the same time showed a small candle.


publishing negative information is to force investors to build the demand against the intentions of investors who create the market and affect the price.

 I believe that the decrease in prices in the area from 1350 -40 dollars per ounce can risk a long position with a stop loss high. Additional please find below my technical analysis of the gold.


oscarjp


The information contained in this publication is not intended as an offer or solicitation for the purchase or sale of any financial instrument. Any opinion offered herein reflects oscarjp-chrimatistikos current judgment and may change without notice. Users acknowledge and agree to the fact that, by its very nature, any investment in shares, stock options and similar and assimilated products is characterised by a certain degree of uncertainty and that, consequently, any investment of this nature involves risks for which the user is solely responsible and liable.

Thursday 16 May 2013

100% profitable days in the 1Q 2013 - unfortunately not me

as shown in the 1Q financial statements Bank of America in the first three months of this year, Bank has had 100% profitable trading days:

"The histogram below is a graphic depiction of trading volatility and illustrates the daily level of trading-related revenue for the three months ended March 31, 2013 compared to the three months ended December 31, 2012. During the three months ended March 31, 2013, positive trading-related revenue was recorded for 100 percent, or 60 trading days, of which 97 percent (58 days) were daily trading gains of over $25 million. These results can be compared to the three months ended December 31, 2012, where positive trading-related revenue was recorded for 97 percent, or 59 of the 61 trading days, of which 69 percent (42 days) were daily trading gains of over $25 million and the largest loss was $50 million."


a similar situation can boast bank JP Morgan, which also reported a 100% profitable trading days. 


the graph shows that the most profitable day brought the bank $ 200 million.

soon more investment banks will praise the results in quarterly reports. This is another proof that they are the only entities in the financial market which receive profits from trading. Therefore it is important to build own investment strategies on the basis of their opinions. It is the banks generate demand on the market and create  a trend for the rest of the investors.

best regards,
oscarjp


Tuesday 14 May 2013

Goldman: AUD Is Doomed; To Fall To 0.80 On Pure Macro Fundamentals

an hour ago appeared Goldman's analysis regarding the Australian dollar


"The recent break below parity of AUD/USD is getting most of the market's attention.

In part, the AUD weakness reflects the dovish tone of the RBA, but the bigger driver is likely to be the rise in US rates, on the back of the recent batch of better US data, which has generated a USD rally across the board, says Goldman Sachs.

Such a move in AUD/USD has led market participants to ask how far the AUD could weaken against the greenback and, relatedly, whether or not AUD/USD will recouple from its traditional drivers – namely interest rate differentials and commodity prices.

To address this question, Goldman Sachs looks into where AUD/USD should be trading given its most basic macro fundamentals:

"The current 2-year swap rate differential between the two countries and Australia’s terms of trade. Over long periods of time, these have been the central parts of most successful models of the AUD. Based on our 'fair value' estimate for the 2-year swap rate differential and our year-ahead forecast for Australia’s terms of trade, our model suggests that the cross could fall to 0.80 at least, judging by the macro outlook," GS finds out.

 "This is in line with our current estimate of fair value, GSDEER. However, our fair value estimate suggests that AUD/USD could fall further – GSDEER is 0.74 in 2016 – reflecting our expectation that Australia’s terms of trade will continue to deteriorate sharply. If commodity prices continue to fall, the macro backdrop for the AUD would imply potentially even more," GS adds". 


chart 1. AUD/USD H1

the first chart shows increased volume on Thursday. That is participation of the investment bank.


chart 2. AUD/USD D1
the second chart, it is clear that we are approaching the end of the correction, therefore the strong message from the bank to "pierce" the essential support levels on the chart.


regards,
oscarjp


The information contained in this publication is not intended as an offer or solicitation for the purchase or sale of any financial instrument. Any opinion offered herein reflects oscarjp-chrimatistikos current judgment and may change without notice. Users acknowledge and agree to the fact that, by its very nature, any investment in shares, stock options and similar and assimilated products is characterised by a certain degree of uncertainty and that, consequently, any investment of this nature involves risks for which the user is solely responsible and liable.


Monday 13 May 2013

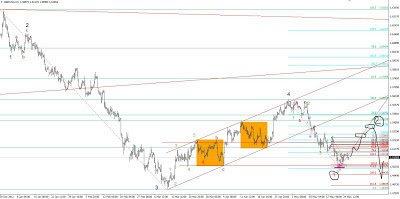
Is Goldman Sachs will increase the asset purchase package?


The Bank of England kept its main interest rate unchanged at 0.5 percent. Size of the asset purchase program (quantitative easing monetary policy, ie QE) remained unchanged at 375 billion pounds.

The key may be taking at the beginning of July the management of the Bank of England by Mark Carney, the current governor of the Bank of Canada.

Carney spent thirteen years with Goldman Sachs in its London, Tokyo, New York and Toronto offices. His progressively more senior positions included co-head of sovereign risk; executive director, emerging debt capital markets; and managing director, investment banking.

Increasing the asset purchase program would mean one thing, a sudden weakening of the British pound relative to major currencies including the U.S. dollar.

what expect Goldman Sachs ?

Let's observe the behavior of the market.

chart 1. GBP/USD H1


chart 2. GBP/USD H4


chart 3. GBP/USD W1


Good luck,
oscarjp


The information contained in this publication is not intended as an offer or solicitation for the purchase or sale of any financial instrument. Any opinion offered herein reflects oscarjp-chrimatistikos current judgment and may change without notice. Users acknowledge and agree to the fact that, by its very nature, any investment in shares, stock options and similar and assimilated products is characterised by a certain degree of uncertainty and that, consequently, any investment of this nature involves risks for which the user is solely responsible and liable.

Monday 6 May 2013

FWIG20 - 6th May

                      Polish Index (Futures WIG20)

Actually we are close the end of the downward trend which lasted from the beginning of the year. The resulting 5-waves structure which means we will expect the next move downward. The chart presented two possible scenarios, which one of them predicted descent to new lows.

Regards,
oscarjp


The information contained in this publication is not intended as an offer or solicitation for the purchase or sale of any financial instrument. Any opinion offered herein reflects oscarjp-chrimatistikos current judgment and may change without notice. Users acknowledge and agree to the fact that, by its very nature, any investment in shares, stock options and similar and assimilated products is characterised by a certain degree of uncertainty and that, consequently, any investment of this nature involves risks for which the user is solely responsible and liable.

Wednesday 1 May 2013

false information from Goldman Sachs a chance to buy EUR/USD

hello traders,

April 25, during the day there was news that Goldman Sachs expects a reduction of interest rates by the ECB in the coming days. (3060-3010)

After the publication of information, appeared a large number of orders to buy the dollar (EUR/USD short) what helped "to pack" the Smart Money in the long position. euro dropped from 3060 to 3010.

Today, we have a 1st May, high price is 3240 (profit of Smart Money around 2 figures)

Current technical analysis of EUR/USD and other currency pairs will appear in the near future.

best,
oscarjp
                 

pic. 1


chart 1


The information contained in this publication is not intended as an offer or solicitation for the purchase or sale of any financial instrument. Any opinion offered herein reflects oscarjp-chrimatistikos current judgment and may change without notice. Users acknowledge and agree to the fact that, by its very nature, any investment in shares, stock options and similar and assimilated products is characterised by a certain degree of uncertainty and that, consequently, any investment of this nature involves risks for which the user is solely responsible and liable.