Thursday 27 March 2014

the real inflation fear in U.S. & the real recovery fear in E.U.

hi All,

the real recovery fear in E.U.

Below is a chart from the Wall Street Journal article. At the top of the left side is the euro versus a basket of 20 currencies - you can see a clear strengthening.
A little below is presented, CPI, at the bottom of the deposit rate at the ECB. On the right loan banking sector to the private sector.

All graphs show a weak situation in the euro area and the need for action by the ECB. The mandate of price stability is not met, and the low activity of banks will not support a recovery in the euro area.

Pronounce article is similar. Expression of members of the ECB before few days foreshadow subsequent operations of the bank. There is just no more time to lose. Meanwhile, the Euro is still high against the dollar. ECB meeting next week.

chart 1. The WSJ, 2014-03-26

the real inflation fear in U.S.

"The weather is to blame but what happens when pent-up demand bumps up against a drought-stricken west coast unable to plant to meet that demand? The spot price (not futures speculation-driven) of US Foodstuffs is the best performing asset in 2014 - up a staggering 19%..."

chart 2. CRB US Spot Foodstuff Index, 2014-03-26, source: Bloomberg

best regards,
oscarjp

Wednesday 26 March 2014

SP500 Index - where is Smart Money ?

hello,

In reference to yesterday's entry for the probability of correction on the U.S. stock market, today, I decided to publish a very interesting Index.


Smart Money Flow Index

Index description:
The Smart Money Flow Index is calculated by taking the action of the Dow in two time periods: the first 30 minutes and the close. The first 30 minutes represent emotional buying, driven by greed and fear of the crowd based on good and bad news. There is also a lot of buying on market orders and short covering at the opening. Smart money waits until the end and they very often test the market before by shorting heavily just to see how the market reacts. Then they move in the big way. These heavy hitters also have the best possible information available to them and they do have the edge on all the other market participants. To replicate this index, just start at any given day, subtract the price of the Dow at 10 AM from the previous day's close and add today's closing price. Whenever the Dow makes a high which is not confirmed by the SMFI there is trouble ahead.

chart 1. Smart Money Flow Index, 2014-03-26

It is easy to notice the growing spread between both Indexes. What can mean outflow Smart Money Flow from the stock market. Given the recent behavior of the SP500 Index over time, it can be concluded that this is another argument for a correction in the United States. In addition, I put the update in comparison to yesterday's chart the SP500 Index.

Today, during the European session Index once again tested the upper levels of the lateral channel. At the moment, the market showed weakness and during the U.S. session, we are witnessing the testing of the lower levels of the channel.

chart 2. fSP500 Index Daily, 2014-03-26

regards,
oscarjp


The information contained in this publication is not intended as an offer or solicitation for the purchase or sale of any financial instrument. Any opinion offered herein reflects oscarjp-chrimatistikos current judgment and may change without notice. Users acknowledge and agree to the fact that, by its very nature, any investment in shares, stock options and similar and assimilated products is characterised by a certain degree of uncertainty and that, consequently, any investment of this nature involves risks for which the user is solely responsible and liable.

Tuesday 25 March 2014

SP500 Index on the "financial" doping

hello,

From a few days we observe on the U.S. stock market lateral movement in the price range between 1864 and 1851 points. Saying more, since 7th March we can notice a slight downward movement. Marked on the chart with a red line. <chart 1>

chart 1. fSP500 Index Daily, 2014-03-25

In the postwar history of Wall Street we had to deal with twelve bull markets, and the average length of a bull market is 4.7 years. The longest growth lasting in the years 1980 - 1989, but it can be justified high economic potential of U.S. at the time. The current growth is celebrating the fifth anniversary of what has been only half the growth cycles. Only 3 times the boom lasted six years. If you look at the parallels, the previous boom in the years 2003-2007 was completed after 20 quarters, or in a time where we are now. But this is only statistics :)

Very interesting look the groundwork of these increases and it is not this time of the foundations of the American economy, but about investors' portfolios. U.S. investors borrowing from brokers is the highest in history, and now it is approaching the limit of 500 billion dollars. It is a natural phenomenon that during the bull market, investors buy a share using the credit, but this raises a serious consequence. In the event that starts the correction, it can be violent. Declines on the indexes and companies will lead to the closure of brokerage accounts and selling shares on the market.

And once again, more statistics :)
Currently, a 12-month forecast PE ratio (price / earnings) reached a value higher than the high in 2007. In the past thirty years, the value of this ratio in the area of 15-17 was the reason for the reversal of the upward trend <chart 2>. The exception was the technology bubble, during which the index has grown even to the level of 25. Then investors bought companies that do not earned, hence such a high valuation. Now the basics are healthier, but pricing is still high. Since 1976, the PE ratio reached a value higher than 17, only 2 times - just when the technology bubble and on the four months at the turn of 2003/2004. Currently, this ratio ranges from 15.4 to 17.4, depending on the source.

chart 2. SP500 12m forward P/E ratio

According to Goldman Sachs at the end of the year we can see the SP500 Index on the 1900 pts., But on the other hand, the bank believes that the S&P is overvalued by looking at almost any measure! Goldman Sachs calculates that the SP500 Index is overvalued by looking at the following indicators: PE, EV/Sales, EV/EBITDA, free cash flow, book value, inflation, interest rates. SP500 Index is also overvalued by 30% by looking at operating EPS and 45% looking at the reported revenues.

At the end, I just want remind you:
Three rounds of bond purchases from the Federal Reserve have helped fuel economic growth, sending the SP500 Index surging as much as 178 percent from its 2009 low. Fed Chair Janet Yellen said on March 19 that the central bank’s stimulus program could end this fall and benchmark interest rates may rise about six months later.

Fed Bank of Philadelphia President Charles Plosser said in an interview on CNBC today that the central bank wants to get back to normal policy, and that he doesn’t think the Fed changed its position on a rate rise.

keep focus
best regards,
oscarjp

The information contained in this publication is not intended as an offer or solicitation for the purchase or sale of any financial instrument. Any opinion offered herein reflects oscarjp-chrimatistikos current judgment and may change without notice. Users acknowledge and agree to the fact that, by its very nature, any investment in shares, stock options and similar and assimilated products is characterised by a certain degree of uncertainty and that, consequently, any investment of this nature involves risks for which the user is solely responsible and liable.

Monday 24 March 2014

gold market - stop loss activated

hello,

With reference to the earlier entries.
<Gold 1>
<Gold 2>
<Gold 3>

At work, where You are be a trader, investor or speculator always have to assume that the market will not go in the direction in which it originally You expected. Today was such a moment. According to my analysis I was expecting increase of gold prices in the near future. Unfortunately, the market from the beginning of the day began to fall in price, reaching levels of my stop loss and I had to close the position. Nevertheless, the loss has not proven to be large, since in accordance with the investment policy when making transactions already know what will be my maximum possible loss.

Taking the opportunity, I still believe that in the near future, the price of gold will be growing. I set my buy positions at a price of 1300 USD. Target has not changed and I still think that prices will go around 1420 USD.

In summary:
long position near: 1300 USD
SL near:                    1290 USD
target:                       1420 USD

Finally, I add today's article regarding gold prices, published on the bloomberg.com <bloomberg>.

regards,
oscarjp

Saturday 22 March 2014

closing positions before the weekend

welcome :)

Below, (before the weekend) You will find the realized profits of the transaction described in the entry dated 19 March <here>.


chart 1. EUR/USD H1, 2014-03-2

In both transactions has been achieved profits. 

trade level:     1) 1.3892;     2) 1.3929;
position:         1) SHORT;   2) SHORT;
SL:                 1) 1.3877;     2) 1.3882;
closed:           1) 1.3798;     2) 1.3798; 
profits (pips):  1)    94          2)    131

chart 2. USD/JPY M30, 2014-03-21

Regarding USD/JPY I have closed also both transactions from March 12 (you can read about this trade in the 20th Summary <link>) and March 19.

trade level:      1) 103.335;     2) 102.354
position:          1) SHORT;     2) SHORT;
SL:                  1) 102.335;     2) 102.821;
closed:            1) 102.286;     2) 102.286;
profits (pips):   1)  1094          2)    68

chart 3. GOLD H1, 2014-03-19

And the icing on the cake, namely GOLD. Regarding, this metal I have a much longer plans. Trade from 3rd March was already closed and right now I am in the process to buy next contracts with hope to reach the level of 1420 as mentioned in previous entries.

trade level: 1331.65
position:     LONG
SL:            1317.87

have a nice weekend,
regards,
oscarjp

The information contained in this publication is not intended as an offer or solicitation for the purchase or sale of any financial instrument. Any opinion offered herein reflects oscarjp-chrimatistikos current judgment and may change without notice. Users acknowledge and agree to the fact that, by its very nature, any investment in shares, stock options and similar and assimilated products is characterised by a certain degree of uncertainty and that, consequently, any investment of this nature involves risks for which the user is solely responsible and liable.

Wednesday 19 March 2014

after Janet Yellen's conference and my trades

hello,

Chair Yellen's first post-meeting press conference came across as slightly more hawkish than expected.

Janet Yellen's FOMC statement showed another $10bn taper but the wordy shift from quantitative thresholds to "we'll know it when we see it" qualitative guidance is relatively dovish (despite improved economic outlooks):

- FOMC SEES `SUFFICIENT UNDERLYING STRENGTH' IN ECONOMY;
- FOMC SAYS IT WILL LIKELY REDUCE QE IN `FURTHER MEASURED STEPS';
- FED: LOW TARGET RATE APPROPRIATE FOR CONSIDERABLE TIME POST-QE;
- MORE FED OFFICIALS SEE AT LEAST 1% FED FUNDS RATE END OF 2015;

Most importantly perhaps, if expected, forward guidance is now dead, as it is a confirmed failure:

- FED DROPS 6.5% JOBLESS THRESHOLD FOR RAISING FED FUNDS RATE;

another are some highlights:
- FOMC TO WEIGH `WIDE RANGE OF INFORMATION' ON JOBS, INFLATION;
- FED: 2014 GDP GROWTH OF 2.8%-3.0% VS 2.8%-3.2% IN DECEMBER (lower growth);
- FED: END-2014 JOBLESS RATE AT 6.1%-6.3% VS 6.3%-6.6% IN DEC. (but lower unemployment);

next:
- YELLEN SAYS WEATHER HAS WEAKENED ECONOMY IN FIRST QUARTER;
- YELLEN SAYS MOST ON FOMC SEE WEATHER WEAKNESS DISSIPATING;

Main points after conference according Goldman Sachs:
1. The median participant’s forecast for the funds rate (the “dots”) remained at 0.13% at end-2014, but rose 25bp to 1.0% at end-2015 and rose 50bp to 2.25% at end-2016. The median projection for the longer-run rate remained 4.0%. Only two participants expected that the first hike would come in 2016, down from three in December.

2. The Committee adopted qualitative forward guidance by stating that it currently anticipates the fed funds rate to remain in the current 0 to 25 basis point range "for a considerable time after the asset purchase program ends, especially if projected inflation continues to run below the Committee's 2 percent longer-run goal, and provided that longer-term inflation expectations remain well anchored." Looking further ahead, the statement indicated that "even after employment and inflation are near mandate-consistent levels, economic conditions may, for some time, warrant keeping the target federal funds rate below levels the Committee views as normal in the longer run." In addition, the statement said that "the change in guidance does not indicate any change in the Committee's policy intentions as set forth in recent statements." We see this set of outcomes on the forward guidance as relatively neutral.

3. The assessment of economic conditions noted slower activity in recent months, but partly blamed the weakness on "adverse weather conditions." The assessment of household spending and business fixed investment was changed from "has advanced more quickly" to "continued to advance." The description of inflation and inflation expectations was unchanged.

4. As overwhelmingly expected, the Committee continued to taper the pace of its asset purchases by $10bn to $55bn/month, beginning in April. An accompanying statement on the New York Fed website indicated no other changes to operating parameters.

5. Minneapolis Fed President Kocherlakota lodged a dovish dissent, noting that the Committee did not express its commitment to return inflation to the 2 percent target strongly enough.

6. With regard to participants’ economic projections, the mid-point of the central tendency of the unemployment rate was lowered by 0.25pp to 6.2% in 2014Q4, by 0.2pp to 5.75% in 2015Q4, and by 0.15pp to 5.4% in 2016Q4. In addition, the longer-run or “structural” unemployment rate was lowered 0.1pp to 5.4%. Real GDP growth was lowered to 2.9% in 2014, 3.1% in 2015, 2.75% in 2016, and 2.25% in the longer run. Changes to core and headline PCE inflation projections were minor. The core PCE inflation projection remained at 1.5% at end-2014, rose a touch to 1.85% at end-2015, and remained at 1.9% at end-2016.

In addition, I present some of my trades made ​​before and after the conference. Together with the levels of Stop Loss.

chart 1. EUR/USD H4, 2014-03-19

underlying: EUR/USD
trade level: 1) 1.3892;     2) 1.3929
position:     1) SHORT;   2) SHORT
SL:            1) 1.3877;      2) 1.3882

chart 2. USD/JPY H4, 2014-03-19

underlying: USD/JPY 
trade level: 102.354
position:     SHORT
SL:            102.821

chart 3. GOLD H1, 2014-03-19

underlying:  GOLD
trade level: 1331.65
position:     LONG
SL:            1317.87

best regards,
oscarjp

The information contained in this publication is not intended as an offer or solicitation for the purchase or sale of any financial instrument. Any opinion offered herein reflects oscarjp-chrimatistikos current judgment and may change without notice. Users acknowledge and agree to the fact that, by its very nature, any investment in shares, stock options and similar and assimilated products is characterised by a certain degree of uncertainty and that, consequently, any investment of this nature involves risks for which the user is solely responsible and liable.

Sunday 16 March 2014

20. Summary of the trades (March 3rd, 2014 - March 15th, 2014)

hello,

It's time for the next summary of all transactions placed on my blog over the last two weeks.

They were an amazing two weeks in which there was higher volatility than the standard average. There were many opportunities for rapid earnings but unfortunately at the expense of starting the war between Russia and Ukraine. Unfortunately, it is difficult to predict the outcome of this conflict. One thing is clear, it certainly will not bring any Member of added value. And probably killed many innocent people.

Here is an overview of all transactions.


In accordance with the investment policy of which I have often mentioned. With the onset of the weekend I decided to close all transactions. With the exception of the two transactions. Gold and USD/JPY.

Why ? already I hurry with an explanation

The main reason for that are closed all transactions is the inability to react to the events that will be shown during the weekend. Therefore markets may open up a large gap which is not always desirable effect.

Stay open two transactions in GOLD and USD/JPY was supported by exactly four arguments.

1) already earned a large profit on these transactions (far from the levels of trades);
2) historically low probability of large gaps at the opening (in contrast to the stock market or EUR/USD);
3) small size scales, the transaction compared to the size of the portfolio;
4) last argument, more speculative - rather expected bad news than good during the weekend.

Summary of trades

Descriptions of all transactions can be found by clicking the links given above.

I realize that sometimes it is hard to explain the reasons for which are bought or sold some transactions, so if while reading my entries you would like to ask a question or leave a comment. It would be very nice.


best regards,
oscarjp chrimatistikos

Saturday 15 March 2014

last week with the Republic of China

Hello,

Next data proved to be blow for investors who believe in the "guaranteed" by the government of 7.5% GDP growth this year. It turned out that both retail sales and industrial production in February was well below expectations. 

Retail sales y/y: actual: 11.8%; forecast: 13.5%; previous: 13.6%
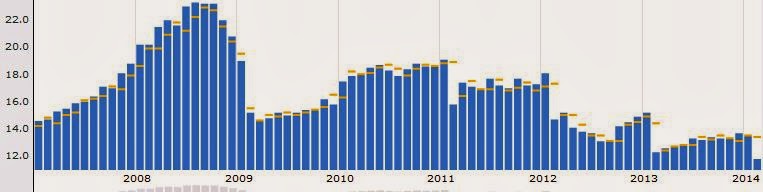
chart 1. retail sales in China m/m

Fixed asset investment ytd/y: actual: 17.9%; forecast: 19.5%; previous: 19.6%
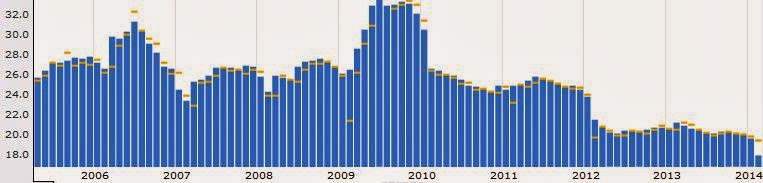
chart 2. fixed asset investment m/m

Interesting is, however, another statistic. In February of investment in urban areas rose by 17.9%. Looking through the prism of the developed economies, or even the majority of developing economies is insane tempo. However, the data were disappointing, as the market hoped for more than 19%. What's more, it shows that even at such a small slowdown in the sector of the economy the whole body gets out of breath.

Industrial production y/y: actual: 8.6%; forecast: 9.5%, previous: 9.7%
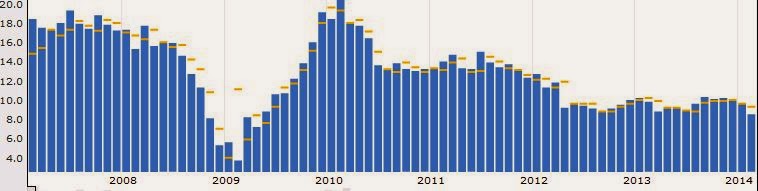
chart 3. industrial production m/m

The weak data coming after earlier warnings from the export and PMI.

HSBC Final Manufacturing PMI: actual: 48.5% (below 50%, which means stagnation, no growth)
chart 4. HSBC final manfacturing PMI m/m

Investment in real estate sector for the last 12 months counted to February increased to a record 15.2% of GDP. So even to slow the economy, the structure of the whole economy has continued to deteriorate.

What does it mean?

If China actually have to change the structure of its growth, more serious slowdown is inevitable. Attempts slight tightening of monetary policy, which have a slightly cool down the real estate market, meant that the demand for them is lower than in the fourth quarter of last year, but the supply continues to grow. It seems, therefore, that if the demand is again not alive, the supply will have to adjust, causing a stronger inhibition of the total economy.

Besides official figures, appeared on the market about the subsequent problems of Chinese steel mills and aluminum. In addition, China's prime minister in an interview with European journalists admitted that many companies in China is facing a harder time, but the government will not save them, because they did not pose a threat to the entire financial system. From the perspective of the commodity market, this means one thing: a high probability of collapse of demand for industrial metals, the lower the growth rate of demand for energy resources and the lack of opportunities for stronger growth in demand for agricultural commodities.

On the markets, iron ore, steel, copper, aluminum, nickel, China represent more than 30% of global demand, and for more than 90% increase in demand in recent years.

Investment banks about Chinese growth:

Banks see growth in the Chinese economy in the first quarter at a level of 7 to 7.5%, it is 0.5 percentage points lower than in the series of data for February. Made the largest cut: BoA Merrill Lynch, lowering the forecast from 8% to 7.3%. At this level of growth also sees Nomura. HSBC predicts 7.5%, while SocGen "minimally above the 7%"


regards,
oscarjp

The information contained in this publication is not intended as an offer or solicitation for the purchase or sale of any financial instrument. Any opinion offered herein reflects oscarjp-chrimatistikos current judgment and may change without notice. Users acknowledge and agree to the fact that, by its very nature, any investment in shares, stock options and similar and assimilated products is characterised by a certain degree of uncertainty and that, consequently, any investment of this nature involves risks for which the user is solely responsible and liable.

USD/JPY short !!! - execution of the established plan

hi,

with reference to previous entries <here> and <here> I would like to show that signals that I published on my blog I use everyday in my trading. I hope that among the readers have also been people who have used the moments to make money in the last week.

chart 1. USD/JPY trade

On the chart presented above showed transactions on USD/JPY where the profit was already 2 figures. This is the only deal that left open for the weekend. The rest of the trades according to my investment policy has been closed before the start of the weekend.

In recent times, over the weekend coming very important information about the armed conflict in Ukraine. On Sunday is scheduled a referendum about separation of the Crimea from the rest of Ukraine. The whole western part of Europe does not accept the referendum, in contrast to Russia. It is worth noting that the results are already known due to the fact that in the Crimea 70 percent of the population are Russian. Previous talks between Kerry and Lavrov did not produce any results. For a week the representatives of Ukraine's drive across Europe and moved to the U.S. to seek help in the conflict with Russia. Unfortunately, outside of financial assistance and sanctions to Russia, Western countries are not able to help Ukraine.

According to the scenario in the coming week, we should test the levels of 100 yen per dollar.

regards,
oscarjp

The information contained in this publication is not intended as an offer or solicitation for the purchase or sale of any financial instrument. Any opinion offered herein reflects oscarjp-chrimatistikos current judgment and may change without notice. Users acknowledge and agree to the fact that, by its very nature, any investment in shares, stock options and similar and assimilated products is characterised by a certain degree of uncertainty and that, consequently, any investment of this nature involves risks for which the user is solely responsible and liable.

Thursday 13 March 2014

it's time

hello,

In reference to the last entry about the EUR/USD I recommended them observation of the market. More info <here>. 

The appropriate moment to do the transaction was in today. Unfortunately, in the hours when I'm at work so I could share with you my thoughts. I was trade at 13:45 Warsaw time at a price of 1.3942 with Stop Loss at the 1.3975 level.

chart 1. EUR/USD, Daily, 2014-03-13
At the moment, profit is already close to 90 pips and probably managed to find the high in a downward trend for the EUR/USD. Now I lowered Stop Loss at 1.3920 level. Target at the moment I established in the region of 1.3000.

regards,
oscarjp

The information contained in this publication is not intended as an offer or solicitation for the purchase or sale of any financial instrument. Any opinion offered herein reflects oscarjp-chrimatistikos current judgment and may change without notice. Users acknowledge and agree to the fact that, by its very nature, any investment in shares, stock options and similar and assimilated products is characterised by a certain degree of uncertainty and that, consequently, any investment of this nature involves risks for which the user is solely responsible and liable.

Wednesday 12 March 2014

USD/JPY short !!! - rectification the last analysis

hello,

regarding my last analysis about USD/JPY <link> I decided to update the chart because the market did something that should have been foreseen.

Namely, it was created wave upward, instead of downward wave indicated by me. Unfortunately, I did not take into consideration the fact that it could have been built in the whole wave correction number four. I assumed that the fourth wave was completed whole, and we should observe the fifth wave in the medium term downward trend.

At the moment the currency pair is at a very significant level. Which, it really shows that the correction has ended or we still have to go below 100 yen per dollar.

chart 1. USD/JPY, Daily, 2014-03-12

Only in case of a new high, which beat the levels of SL, which is shown on the chart it can be concluded that the down trend on the USD/JPY is completed.

If you have any questions, please send me an email or ask a question in a comment below.

regards,
oscarjp


The information contained in this publication is not intended as an offer or solicitation for the purchase or sale of any financial instrument. Any opinion offered herein reflects oscarjp-chrimatistikos current judgment and may change without notice. Users acknowledge and agree to the fact that, by its very nature, any investment in shares, stock options and similar and assimilated products is characterised by a certain degree of uncertainty and that, consequently, any investment of this nature involves risks for which the user is solely responsible and liable.

Monday 10 March 2014

CAC40, french Index with corection

Hi,

Analyzing the individual Indexes the most important exchanges in Europe, I decided to share just the analysis of the french CAC40 Index. <chart 1>

chart 1. CAC40 Index, Weekly, 2014-03-10
At the moment, the market had drawn the first wave of growth, along with the correction and the third wave of the full complement of internal waves embedded in the third wave. What perfectly coincided with the previous wave of growth (first red square).

It should be noted that this is a weekly chart, so long as the market closes above the red square (weekly candle), it is recommended sell position on the decline in the value of the Index.

If you have any questions, please send me an email or ask a question in a comment below

regards,
oscarjp

The information contained in this publication is not intended as an offer or solicitation for the purchase or sale of any financial instrument. Any opinion offered herein reflects oscarjp-chrimatistikos current judgment and may change without notice. Users acknowledge and agree to the fact that, by its very nature, any investment in shares, stock options and similar and assimilated products is characterised by a certain degree of uncertainty and that, consequently, any investment of this nature involves risks for which the user is solely responsible and liable.

EUR/USD for now without recommendation, observation of the market

hello,

When you consider the fact that the U.S. and Britain is slowly moving towards monetary tightening, while in the euro zone all the time on the table is loosening, we should expect a depreciation of the euro against most other currencies. But this did not happen, and that's because after the ECB cut rates in November, quite unintentionally quickly tightened policy. This unintended change is a side effect of taking over of supervision by the ECB over large banks in the area and the associated stress tests. The tests which lead banks to improve capital adequacy ratios, within which, inter alia, They repay the loan LTRO. The result is a significant decrease in excess liquidity, which made it a de facto in the euro area for many months base rate was equal to 0% deposit rate.

Banks have to decide whether the excess money to put on the market, or to deposit at a rate of 0% in the ECB. Now, when the surplus disappeared, again took the lead role refinancing rate, which in November, the ECB lowered to 0.25%. As a result, market interest grew, attracting capital into euros. Thus, if the euro is to be discounted, the ECB must affect market rates.

After the conference,

The ECB did not lower interest rates, it also not decided on another form of monetary loosening. Moreover, the ECB's CEO suggest that reductions probably will not be. Euro appreciation against the U.S. dollar reacted.

The recovery in the euro area continues to be slow, and inflation remains low. Nevertheless, the ECB already knew and that is why, among other things, lowered the reference rate in November. Since then president Mario Draghi maintains that it is ready to act, but in two cases: if the expected future inflation will be lower than assumed so far by the Bank, or if the decline in market liquidity will lead to a significant tightening by the increase of market interest rates.

A month ago, Draghi indicated that the March meeting will be very important, because the Council of the Bank will be the first time she had available inflation projections for 2016. This projection assumes an increase of inflation from the current 0.8% to just over 1% at the end of 2014, to 1.3% in 2015 and 1.5% in 2016, while in the last quarter of 2016 years will be a already 1.7%.

Projection confirmed previous expectations the ECB of the path of inflation, which Draghi used to keep interest rates unchanged. What's more, he added that the drop in liquidity in the money market at the moment is no excuse for movements in the delivery of such liquidity. This is strong formulation, suggesting that loosening will no longer at all. What may change the point of view of the ECB, the decline of inflation in the coming months and / or a significant deterioration in the PMI Index, which at the beginning of the year are very good.

chart 1. FRA rate & EUR/USD, 2014-03-10

Spread between the market interest rate, and the EUR/USD is very large. However, the declines in the currency pair needed a change of sentiment towards the dollar <chart 1>.

chart 2. Volume of the futures on EUR/USD, 2014-03-10

It should also show that on the futures contract on EUR/USD on the last day there is a lot of orders at the same time a very small candle on the chart. What does the emergence of very large capital. I personally treat it only as a confirmation. Never as a major factor in decision-making.


regards,
oscarjp

The information contained in this publication is not intended as an offer or solicitation for the purchase or sale of any financial instrument. Any opinion offered herein reflects oscarjp-chrimatistikos current judgment and may change without notice. Users acknowledge and agree to the fact that, by its very nature, any investment in shares, stock options and similar and assimilated products is characterised by a certain degree of uncertainty and that, consequently, any investment of this nature involves risks for which the user is solely responsible and liable.

Monday 3 March 2014

update of the situation on gold

hello,

Gold ideally used the threat of war between Russia and Ukraine and today has established another high at 1350 dollars. I believe that this trend is at the moment not in danger and in the near future, we should reach the levels of 1420 dollars.

Only at this point the market will decide if we will draw a further downward movement by establishing new low or demand proves to be strong and break through this level. Then you will be able to talk about the end of the correction in the gold market, which lasted from September 2011.

But until then, I recommend a long position. At the moment do not put a stop loss.

chart 1. Gold Daily, 2014-03-03
regards,
oscarjp

The information contained in this publication is not intended as an offer or solicitation for the purchase or sale of any financial instrument. Any opinion offered herein reflects oscarjp-chrimatistikos current judgment and may change without notice. Users acknowledge and agree to the fact that, by its very nature, any investment in shares, stock options and similar and assimilated products is characterised by a certain degree of uncertainty and that, consequently, any investment of this nature involves risks for which the user is solely responsible and liable.

19. Summary of the trades (February 16th, 2014 - March 3rd, 2014)

hello,

"We believe that any aggression, any military escalation could lead to unpredictable consequences."

Any attempt to play the "long" are currently very risky at this moment. Every minute, information coming from Ukraine. It's hard to predict what might happen in an hour or two. Index comprising the 20 largest companies listed on the Warsaw Stock Exchange lost more than 5 percent today.

Over the last 14 days I have published only two transactions. The first involved a short position on fWIG20 Index, and the second also a short position on currency pair USD/JPY.

trade 1

trade 2

Summary of trades
In the case of USD / JPY as showed there is still a lot of space to falls so highly Stop Loss leave, looking at the development of the situation.

In relation fWIG20 Index as showed in the analysis, today we overcame the first level of support at 2412 points, and I think tomorrow we should test the level of 2382 points. In the coming days we receive a response Is realize the first or second scenario.

regards,
oscarjp

Sunday 2 March 2014

USD/JPY short !!!

Hi,

Taking into account the information coming from Ukraine. It should take into account the high risk of the outbreak of hostilities on the territory of Ukraine. Following information from the Eastern and Western news agencies, I believe that there is a high risk of a repetition of the situation that occurred in 2008 and Russia's attack on Georgia.

In view of the precarious situation should focus in the coming days on the currency, which are particularly liked by investors. I mean the JPY and CHF. We should expected weakening of emerging market currencies.

In the case of USD/JPY Technical Analysis also shows a lot of space to falls in around 100 yen per U.S. dollar.


chart 1. USD/JPY H4, 2014-03-02


regards,
oscarjp

The information contained in this publication is not intended as an offer or solicitation for the purchase or sale of any financial instrument. Any opinion offered herein reflects oscarjp-chrimatistikos current judgment and may change without notice. Users acknowledge and agree to the fact that, by its very nature, any investment in shares, stock options and similar and assimilated products is characterised by a certain degree of uncertainty and that, consequently, any investment of this nature involves risks for which the user is solely responsible and liable.