Friday 31 January 2014

low inflation means strong dollar

hello,

My recommendation dated 27 January has proven to be perfect investment in generating good result.

recommendation short
recommendation short - develop my conclusions

Before we proceed to analyze the interest rate market, I will present data that have in recent days the biggest impact on the behavior of the EUR/USD.

Germany - inflation in some regions (for January):
Brandenburg -0.4 m/m, 1.5% y/y; 
Hesse -0.5 m/m, 1.2% y/y; 
Bavaria -0.7% m/m, 1.1% y/y; 
North Rhine-Westphalia -0.6% m/m, 1.7% y/y.

Germany - CPI inflation (for January): 1.3% y/y, expected 1.5% y/y;
HICP inflation of 1.2%. Expected 1.3%; 
Readings m/m: 
CPI: -0.6% Expected -0.4%;
HICP: -0.7%. Expected -0.6%

HICP inflation in the euro area in January: 0.7% y/y 
The consensus: 0.9% y/y previously: 0.8% y/y 
Core inflation: 0.8% y/y, consensus: 0.8% y/y

The interest rate market reacts to all the curves. From short-term contracts after long-term contracts are expected to loosen the ECB due to weak inflation reading.

FRAs contracts 9×12 and 18×24 are at the lowest level since May 2013, and 3×6 tests the level of November last year.

Market expectations are therefore unambiguous, we all expect to start on a larger scale easing in the European Union. The use of additional tools with representatives of the ECB said many times. Among other things, today Mr. Coeure. So, we wait until February 6, when the conference will be held at the voice of Mario Draghi takes.

chart 1. FRAs contracts 2014-01-31 
chart 2. spread between 10Y Govt bond Ger & U.S. 2014-01-31
regards,
oscarjp

The information contained in this publication is not intended as an offer or solicitation for the purchase or sale of any financial instrument. Any opinion offered herein reflects oscarjp-chrimatistikos current judgment and may change without notice. Users acknowledge and agree to the fact that, by its very nature, any investment in shares, stock options and similar and assimilated products is characterised by a certain degree of uncertainty and that, consequently, any investment of this nature involves risks for which the user is solely responsible and liable.

Monday 27 January 2014

gold, when start 5th wave?

hello traders,

In recent times, if there are already articles on gold is mostly relate to either the recovery the gold stolen by the Nazis during the war by the Bundesbank from United States of America or Manipulation Gold Price Fixing where the consequence was the resignation of Deutsche Bank to take part in the fixing.

A several quotes from Reuters:
"Deutsche Bank is withdrawing its participation in the gold and silver benchmark setting process following the significant scaling back of our commodities business. We remain fully committed to our precious metals business."

"In mid-December, German banking regulator Bafin demanded documents from Deutsche Bank under an inquiry into suspected manipulation of benchmark gold and silver prices by banks, the Financial Times reported, citing sources."

"Bafin declined to comment on Friday, but its President Elke Koenig said the previous day that it was understandable that the topic was attracting widespread concern."

"These allegations (about currencies and precious metals) are particularly serious, because such reference values are based - unlike LIBOR and Euribor - typically on real transactions in liquid markets and not on estimates of the banks."

Without a doubt, at the moment the gold market runs through the black clouds. Today came another news talking about the reasons for such a large and long correction in the gold market.

"One of the big disconnects over the past year has been the divergence between the price of paper gold and the seemingly inexhaustible demand for physical gold, from China all the way to the US mint. Today we get a hint on how this divergence has been maintained: it now appears the main culprit is the massive boost in supply by gold mints around the world working literally 24/7, desperate to provide enough supply to meet demand at depressed prices in order to avoid a surge in price as bottlenecked supply finally catches up with unprecedented physical demand."

Bloomberg reports that "global mints are manufacturing as fast as they can after a 28 percent drop in gold prices last year, the biggest slump since 1981, attracted buyers of physical metal. The demand gains helped bullion rally for five straight weeks, the longest streak since September 2012. That won’t be enough to stem the metal’s slump according to Morgan Stanley, while Goldman Sachs Group predicts bullion will "grind lower" over 2014." Odd - one could make the precisely opposite conclusion - once mints run out of raw product, the supply will slow dramatically forcing prices much higher and finally letting true demand manifest itself in the clearing price.

More from Bloomberg:
“The long-term physical buyers see these price drops as opportunities to accumulate more assets,” said Michael Haynes, the chief executive officer of American Precious Metals Exchange, an online bullion dealer. “We have witnessed some top selling days in the past few weeks.”

The propaganda is well-known: “Prices are likely to drop further as global economic conditions are stabilizing and tapering worries continue,” said Rob Haworth, a senior investment strategist in Seattle at U.S. Bank Wealth Management, which oversees about $110 billion of assets. “There is no doubt that physical demand has improved, but it will not be enough to support prices." Uhm, yeah. That makes no sense: what happens when global mints are hit by capacity bottlenecks from gold miners for whom it is becoming increasingly more economic to just halt production at sub-cost levels.

Meanwhile, here is a case study of how individual mints are working overtime to plug the unprecedented demand comes from Austria:

Austria’s mint is running 24 hours a day as global mints from the U.S. to Australia report climbing demand for gold coins even while Goldman Sachs Group Inc. says this year’s price rebound will end.

Austria’s Muenze Oesterreich AG mint hired extra employees and added a third eight-hour shift to the day in a bid to keep up with demand. Purchases of bullion coins at Australia’s Perth Mint rose 20 percent this year through Jan. 20 from a year earlier. Sales by the U.S. Mint are set for the best month since April, when the metal plunged into a bear market.

It's not just Austria. Presenting the US Mint:

The U.S. Mint, the world’s largest, sold 89,500 ounces so far this month. The Austrian mint that makes Philharmonic coins, saw sales jump 36 percent last year and expects “good business” for the next couple of months, Andrea Lang, the marketing and sales director of Austria’s Muenze Oesterreich AG, said in an e-mail.

“The market is very busy,” Lang said. “We can’t meet the demand, even if we work overtime.”

The price for the Austrian mint’s 1-ounce Philharmonic gold coin slumped 27 percent last year, according to data from the Certified Coin Exchange.

“It’s been a very bad year for gold,” said Frank McGhee, the head dealer at Integrated Brokerage Services LLC in Chicago. “People who bought coins have lost value, but they are not looking at short-term gains, and hope springs eternal.” 

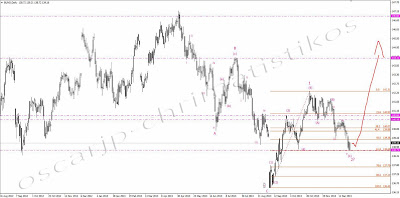
Time has come for my analysis, together with the recommendation. At the moment we are in the creation of the last wave correction A-(X)-B-1-2-3-4-5C with marked potential levels of support. I buy a shorts with Stop Loss set at $ 1,290 <chart below>

chart 1. Gold Market Daily, 2014-01-27

Dear readers if You have any questions regarding Gold Market or something different lease do not be ashamed. On the right side is the possibility to write me a message.

best regards,
oscarjp

The information contained in this publication is not intended as an offer or solicitation for the purchase or sale of any financial instrument. Any opinion offered herein reflects oscarjp-chrimatistikos current judgment and may change without notice. Users acknowledge and agree to the fact that, by its very nature, any investment in shares, stock options and similar and assimilated products is characterised by a certain degree of uncertainty and that, consequently, any investment of this nature involves risks for which the user is solely responsible and liable.

fast entry - be careful on EUR/USD - develop my conclusions

hello,

as I promised in the morning. In this post, I develop my thought. Unfortunately, the lack of time I was not able to make it in the morning therefore I'm doing it now.

Here you have a link to the entry from the morning. <link :)>

The head of the European Central Bank during his speeches in Davos hinted that does not share much concern the International Monetary Fund, which argued that the ECB should be more actively counter the risk of the occurrence of deflation, it is something that is worth paying attention to. In recent weeks, the market pondered what instruments can use the European Central Bank as a further loosening of monetary policy. A passivity and vagueness by Mario Draghi resulted in the situation that occurred even argue that the ECB did not really have many options - the result was some "hesitation" future FRAs rates or an increase in short-term interest rate EURIBOR (though it happens to be more the result of declining excess liquidity in the banking sector as a result of early repayment of loans from the LTRO before the upcoming stress tests of banks).

In addition, a series of better macroeconomic data (PMI) meant that it was possible to think about as far as "doves" this year will be the ECB. Only that Mario Draghi gave last weekend another excuse to discuss what the Financial Times notes today. According to the head of the ECB to engage in quantitative easing program is the truth legally impossible, but the Bank could buy up loans from banks, which they give to the private sector if the economic situation in the area has deteriorated.

Irrespective of how controversial it would move, one thing is certain. Investors finally receive some arguments to the depreciation of the common currency. Especially since the addition at the end of last week was already seen some movement in the rates of EURIBOR and FRAs.

The chart number 1 in the previous post I showed that on Friday for Finance institutions occupy a lot of positions (probably short) which showed the volume, which was much larger than the previous days.

In addition, the quotation EURUSD are now significantly above that, as indicated by the spread yields of 2-year govt. Ger. bonds and the 2Y govt. USA bonds. Spread suggest a decrease again under 1.3600

chart 1. EUR/USD & spread of 2Y Ger and US bonds, 2014-01-27

regards,
oscarjp

The information contained in this publication is not intended as an offer or solicitation for the purchase or sale of any financial instrument. Any opinion offered herein reflects oscarjp-chrimatistikos current judgment and may change without notice. Users acknowledge and agree to the fact that, by its very nature, any investment in shares, stock options and similar and assimilated products is characterised by a certain degree of uncertainty and that, consequently, any investment of this nature involves risks for which the user is solely responsible and liable.

fast entry - be careful on EUR/USD

hello,

fast post before job. The development of thought will be in the evening. (after job :) ). Look at the very high volume and very little body of candle on the chart from Friday.

We can clearly see that someone have taken a large positions. My recommendation: SHORT

chart. 1. EUR/USD, 2014-01-27


regards,
oscarjp

Wednesday 22 January 2014

fWIG20 Index very interesting moment at the chart

hello traders,

Before you start read this entry, please visit my earlier post regarding currently situation in Poland. This will allow you to better understand the current situation:


The changes in the system of of open pension funds in 2014 will have a big impact on the Stock Exchange in Warsaw. Significant confusion bring abrupt changes and their 3-phase character. First, the shortest phase is January. As of the end of January of open pension funds will have to give 51.5% of their assets to the Social Insurance Institution. At the end of November last year, open pension funds (OPF) were forced to sell shares to get the money needed to meet this condition. So in December we witnessed the correction. Still, this means limited potential for growth in January and could still mean supply.

It depends on the behavior of stock markets in January and the level of cash that pension funds will want to keep in their portfolios. According to estimates most likely supply a 0.5-1.5 bilion PLN shares, but may be derived partly from a more liquid foreign shares, which in turn can absorb the shock potential. Now, theoretically, the share of stocks in the portfolios of pension funds after the transfer of 51.5% increase to about 90%. This is a high level, above the minimum (75% for the first year) and does not leave much space for further purchases of shares.

It is difficult to expect such purchases as in 2013 when their balance amounted to a record of more than 17 billion PLN.

The second phase will run from February to the end of July, when the OPF will receive strong inflows of the order of 0.9 billion PLN per month, and still not be encumbered with any outflows. In addition, from April will continue choosing between pension funds and Social Security, so the pension funds will be motivated to achieve good results. In addition, begin to change management policies and portfolios, and at least the first steps in this direction.

There will be no internal benchmark and system of penalties for deviation from the average rate of return for all pension funds. Also, limit investment in foreign shares will increase considerably (up to 10% in 2014 and to 30% by the end of 2016). It is not known how far and how fast OFE decide to make changes to their portfolios.

The third phase will begin in August. Then it will already know how many people took the decision to remain in the pension funds, and besides inflows, there will be outflows that result from the introduction of "slider". Net flow depends on the size of contributions that will continue to flow, but estimates suggest that about 25% if the current remains in the OPF is roughly balances the inflows with outflows.

In the chart, the situation is as follows. On today's market reached levels where you could potentially talk about the end of correction. However, it is possible that the market may test the 2,475 points level yet. As shown on the chart below. Medium-term trend, however, should be maintained, and within the next few days we should see lower levels than today.

chart 1. fWIG20 Index H1, 2014-01-22

trade safe,
oscarjp

The information contained in this publication is not intended as an offer or solicitation for the purchase or sale of any financial instrument. Any opinion offered herein reflects oscarjp-chrimatistikos current judgment and may change without notice. Users acknowledge and agree to the fact that, by its very nature, any investment in shares, stock options and similar and assimilated products is characterised by a certain degree of uncertainty and that, consequently, any investment of this nature involves risks for which the user is solely responsible and liable.

Monday 20 January 2014

FED activities over the past five and a half years

hello,

found on the web quite interesting presentation showing FED activities. enjoy it

"Back on November 25, 2008, in response to the complete wipe out in the capital markets, the Fed quietly announced its foray into Quantiative Easing, which was expanded in March of the following year, and the de facto start of the New Normal Centrally Planned regime."

491 days later, on March 31, 2010, QE1 was "tapered."

"206 days later, when the market had gone exactly nowhere, the Fed commenced QE2 which had previously been disclosed at the 2010 Jackson Hole conference."

"QE2 continued for 250 days and fully "tapered" on June 30, 2011."

"83 short days later, with the market tumbling, the Fed had no choice but to continue its central banking press, and on September 21, 2011 started Operation Twist, which has since turned into QE3, or 4 depending on how one keeps count, also known as open-ended QE."

"A month ago, despite one failed headfake experiment previously, the Fed announced it would begin tapering Open-ended QE by $10 billion, ostensibly by $10 billion at every FOMC meeting, but "data dependent" which of course means if the market is crashing the Fed would stay engaged."

"So central planning continues, and as of January 19, 2014, the latest episode of QE, started in September 2011, has gone on for 851 days."

"Altogether, of the 1881 days starting on November 25, 2008 and continuing through January 19, 2014, the Fed has directly and unambiguously intervened in the markets for a total of 1592 days. It was not been directly involved in the market for a tiny 289 days."

"In sum: the New Normal is best characterized by a Federal Reserve which has been actively manipulating the equity "market" 85% of the time."

chart 1. Fed's central-planning calendar

chart 2. shows how the "stock market" has moved during this period

regards,
oscarjp

Sunday 19 January 2014

Goldman Sachs about EUR/USD

hello,

On Friday (17th January) showed up an interesting note from Goldman Sachs relating current issues of the situation on EUR/USD. Thomas Stolper (GS) indicates a problem with offsetting forces squeeze EUR/USD into a narrow range.

"How often do we hear that EUR/$ will have to weaken because the Fed tightens before the ECB? Well, policy rates are very close to zero and the tapering, i.e., slowing balance sheet expansion by the Fed, has not materially changed the rate differentials even at longer maturities.

With a few exceptions, cross-country correlations in interest rate differentials remain very high. The gap between the Dollar and the Euro, for example, has remained within the same range since June. And that is true for all maturities from 2 to 10 years.

To be fair, EUR/$ rate differentials have recently moved a little bit against the EUR, but the relative current account position remain supportive of the EUR. As a result, we continue to see two offsetting forces squeeze EUR/$ into a relatively narrow range, a situation that could persist." said Thomas Stolper, GS.

Regardless of the above conclusions overcame significant resistance, and it seems that the 1.33-1.32 is most possible.

chart 1. EUR/USD H4, 2014-01-19

regards,
oscarjp

The information contained in this publication is not intended as an offer or solicitation for the purchase or sale of any financial instrument. Any opinion offered herein reflects oscarjp-chrimatistikos current judgment and may change without notice. Users acknowledge and agree to the fact that, by its very nature, any investment in shares, stock options and similar and assimilated products is characterised by a certain degree of uncertainty and that, consequently, any investment of this nature involves risks for which the user is solely responsible and liable.

16. Summary of the trades (January 1st, 2014 - January 17th, 2014)

dear friends,

It's time to the next summary of my activities on the blog during first seventeen days of the new year.

Let me start by analyzing fSP500 Index <recommendation - fSP500 long and short> where I expected that the market will lead to 1830 points and then start correction. At the moment I only have a short position on fSP500 Index all my long positions have closed. Waiting for correction.

Regarding the EUR/USD in a few of my entries I was recommended short positions showing further arguments in favor of my suggestion. <recommendation - EUR/USD>, <recommendation 2 - EUR/USD> and the last <recommenadtion - EUR/USD, lowered the stop loss>. On Friday, we overcame significant resistance, I have already mentioned. I still think that in the next few days we should go down to the levels of 1.33-1.32. On Monday, I'll probably lowered the stops.

And finally my last recommendation <recommendation - fWIG20> in case of the Polish market lot is being said about the large supply of shares from the open pension funds. By the end of the month everything should to clarify. Stop has lowered to 2405 points.

Summary of trades

In the table above, purposely not posted Ger govt. bond transaction <BUND - 10Y Ger Govt Bond>  because it wasn't recommendation but just present two scenarios and the desire to know the opinion of my readers. 

In addition, I placed two transactions <USD/JPY trade> and <fDAX Index trade> without prior recommendation due to lack of time and lack of possibility to insert on blog.

I got a few queries about current situation on the gold market. Right now, I am during the preparation the analysis regarding gold market and updates fWIG20 Index. I think that the analysis should appear on the blog in a few days. So please be patient.

If while reading my analysis and opinion, would like to ask a question. On the main page of your blog on the right side "Contact me" and you can write to me a message. All questions answered.

best regards,
oscarjp

The information contained in this publication is not intended as an offer or solicitation for the purchase or sale of any financial instrument. Any opinion offered herein reflects oscarjp-chrimatistikos current judgment and may change without notice. Users acknowledge and agree to the fact that, by its very nature, any investment in shares, stock options and similar and assimilated products is characterised by a certain degree of uncertainty and that, consequently, any investment of this nature involves risks for which the user is solely responsible and liable.

Friday 17 January 2014

fDAX Index - my today trade

hello,

While this day, I traded a short position on the German DAX Index <chart 1>. I traded a short position at the level of around 9790 with stop loss at 9805. Chart has been analyzed after which realized that it should not beat my stop loss level. The market still later tried to test higher limits but briefly. After a while the market reacted very strongly decrease by more than 50 points. Immediately I decided to lower the stop loss at 9775 level. And then I went back to my old strategy. Namely, the observation of the market and the gradual lowering of the stop. 

The total profit achieved in this trade is 42 points.

chart 1. fDAX Index M5, 2014-01-17

If you have any questions, please write email to me as soon as possible.

regards,
oscarjp

The information contained in this publication is not intended as an offer or solicitation for the purchase or sale of any financial instrument. Any opinion offered herein reflects oscarjp-chrimatistikos current judgment and may change without notice. Users acknowledge and agree to the fact that, by its very nature, any investment in shares, stock options and similar and assimilated products is characterised by a certain degree of uncertainty and that, consequently, any investment of this nature involves risks for which the user is solely responsible and liable.

Thursday 16 January 2014

Credit Suisse and JP Morgan about EUR/USD and GBP/USD

hello,

Yesterday appeared on the market two recommendations of investment banks: Credit Suisse and JP Morgan. I decided to put them on my blog.

But before, the first reminder My analysis. <EUR/USD - my analysis>. Today, I decided to low my stop to the 1.3650 level.

JP Morgan

EUR/USD

"As long as EUR/USD doesn't show a second consecutive lower close below the Ichimoku-cloud (currently at 1.3618) the door remains open for an extended wave 2 rebound to 1.3805/12 (daily breakout line/minor 76.4 %), where a good risk reward selling opportunity would be given", says JP Morgan.

"Only a decisive hourly close above 1.3812 (i.e. above 1.3840) would question the broad bear view which would receive confirmation via breaks below 1.3508 and 1.3468/36 (daily trend/daily Ichimoku-lagging/minor 38.2 %)," JPM adds.

chart 1. JP Morgan analysis of EUR/USD 2014-01-15

GBP/USD

In Cable, JPM thinks "that in order to resume the broader up-trend, it requires a decisive break and hourly close above 1.6518/42 (pivot/minor 76.4 %, i.e. above 1.6570)."

 "As long as such a break has not materialized though, the market remains vulnerable to another test of key-support between 1.6327 (minor 38.2 %) and 1.6272/51 (weekly triangle/c = a) which if taken out would call for a minimum decline to the lower T-junction at 1.6031 (38.2 % on higher scale)," JPM projects. 

Credit Suisse

EUR/USD

"EUR/USD’s consolidation has found fresh selling interest ahead of the 1.3721/29 barrier – 50% retracement of the recent fall – which leaves topping pressure in place", notes Credit Suisse.

"Removal of trendline support at 1.3595/72 is needed to get the downtrend back on track for price and 61.8% retracement support at 1.3528/23 next," CS projects.

"Below here targets the 38.2% retracement of the July/December rally at 1.3458, with the target from the top set lower at 1.3357. Near-term resistance moves to 1.3700. Above 1.3721/29 aims at price and 61.8% retracement hurdles at 1.3742/62, which ideally caps to keep topping pressure intact," CS adds.

 "In line with this view, CS recommends selling EUR/USD strength to 1.3700/20, with a stop above 1.3778, and a target at 1.3460."

chart 2. Credit Suisse analysis of EUR/USD 2014-01-15

regards,
oscarjp

The information contained in this publication is not intended as an offer or solicitation for the purchase or sale of any financial instrument. Any opinion offered herein reflects oscarjp-chrimatistikos current judgment and may change without notice. Users acknowledge and agree to the fact that, by its very nature, any investment in shares, stock options and similar and assimilated products is characterised by a certain degree of uncertainty and that, consequently, any investment of this nature involves risks for which the user is solely responsible and liable.

Monday 13 January 2014

USD/JPY my trade

hi,

I noticed that a long time ago, on my blog was not the topic regarding forecasts for the Japanese yen. Therefore, I decided to present my trade today on the currency pair USD/JPY. At the moment, profit is already 42 pips.

I think that at the moment the trend of weakening the yen ended perfectly 5 wave structure and at the moment I would expect a correction in most pairs associated with the yen.

Range of correction at the moment it is hard to determine exactly therefore I take the strategy of market observation and gradual lowering of Stop Loss.

USD/JPY M1, 2014-01-13

why I decided to take a short position on USD/JPY ?

For a few days I expect the average correction in the SP500, you can read about in my previous entries devoted to the Index. SP500 with currency pairs such as GBP/JPY, CHF/JPY or USD/JPY is very strongly correlated. So on Friday, when the yen began to strengthen and SP500 did not want to fall which resulted in magnification of the gap between them. Today I was almost sure that the strengthening of the yen will continue which will lead to a strong decrease in the SP500 Index which at the moment we are witnessing. Of course, fSP500 Index I also have a short position. :)

trade safe,
regards,
oscarjp

The information contained in this publication is not intended as an offer or solicitation for the purchase or sale of any financial instrument. Any opinion offered herein reflects oscarjp-chrimatistikos current judgment and may change without notice. Users acknowledge and agree to the fact that, by its very nature, any investment in shares, stock options and similar and assimilated products is characterised by a certain degree of uncertainty and that, consequently, any investment of this nature involves risks for which the user is solely responsible and liable.

Sunday 12 January 2014

Non-Farm Employment & EUR/USD - my analysis

Hi again,

in this post I will confine itself to the analysis of the EUR/USD. After the final reading of Non-Farm Employment, which I believe were not negative assume further strengthening of the U.S. dollar against the euro.

At the moment we are in the area, the first stop (yellow area), where the potential correction should be completed. <chart 1>. If the determination euro buyers will be large, it is possible to handle up to 1.3737 levels. However, at the moment I recommend short positions and buying the U.S. dollar.

chart 1. EUR/USD H4, 2014-01-12
The most important task for the dollar will overcome the level of 3670-3654, because closing the day below these levels would open the way towards 1.33

In conclusion, the short position with a stop loss at around 3770-3780 with the target to 1.33


regards,
oscarjp

The information contained in this publication is not intended as an offer or solicitation for the purchase or sale of any financial instrument. Any opinion offered herein reflects oscarjp-chrimatistikos current judgment and may change without notice. Users acknowledge and agree to the fact that, by its very nature, any investment in shares, stock options and similar and assimilated products is characterised by a certain degree of uncertainty and that, consequently, any investment of this nature involves risks for which the user is solely responsible and liable.

Non-Farm Employment & eurozone - my conclusions

Hi,

Friday we got to know the most important figures of the past week. Non-Farm Employment changed only by 74k where investors expected 196k. This information has been read by investors in the first minutes of the negative information which led to the weakening of the dollar against the euro. It is worth noting that the latest reading was revised from 203k to 241k. The unemployment rate fell to 6.7 percent; expected 7.0 percent.

Moments later, appeared the first comments, one of them is worth noting namely Citi believes that "We can see that large investors sell EURUSD upon any small increase in the steam, the data is not much change for QE3"

A little more details regarding Non-Farm Employment.
A breakdown of the data for individual sectors:
- Total: +74k
- Retail Trade: +55 k
- Wholesale Trade: +15 k
- Sector engineering:-16k
- Media and information sector:-12k
- Financial and business services: +19 k
- General government:-13k

On Friday also spoke Lacker (FED): "I expect that the next meeting of the Fed will be a discussion about cut QE3 by  10 billion"

Cut QE by 10 billion dollars also expect Goldamn Sachs and JP Morgan. Goldman Sachs also commented weak reading of Non-Farm Employment: "A low reading the indicator was caused by weather situation in the U.S."

An important event at the end of last week was the appearance of increased demand for bonds.
On Friday, U.S. Treasury yields fell:
2Y fall from 0.4250 to 0.3819,
3Y from 0.8726 to 0.7975, and
10Y from 2.96 to 2.88.

What's more, investors also are buying German bonds, which yields also fal:.
2Y from 0.208 to 0.187,
3Y from 0.322 to 0.296,
and 10Y from 1,886 to 1,850.

Although the movement in the same direction, U.S. yields falling faster than German yields, which favors the euro in the short term, as a consequence of the spread increases.

To better clarify the situation in the euro zone below I will present some data that will be interest of my readers. This is in a sense a continuation of my post "total fail of the European Union" from 16th December 2013

- The unemployment rate in the eurozone as a whole is still sitting at an all-time record high of 12.1 percent;
- Italy, the unemployment rate has soared to a brand new all-time record high of 12.7 percent;
- The youth unemployment rate in Italy has jumped up to 41.6 percent;
- The level of poverty in Italy is now the highest that has ever been recorded;
- Many analysts expect major economic trouble in Italy over the next couple of years. The President of Italy is openly warning of "widespread social tension and unrest" in his nation in 2014;
- Citigroup is projecting that Italy's debt to GDP ratio will surpass 140 percent by the year 2016;
- Citigroup is projecting that Greece's debt to GDP ratio will surpass 200 percent by the year 2016;
- Citigroup is projecting that the unemployment rate in Greece will reach 32 percent in 2015;
- The unemployment rate in Spain is still sitting at an all-time record high of 26.7 percent;
- The youth unemployment rate in Spain is now up to 57.7 percent - even higher than in Greece;
- The percentage of bad loans in Spain has risen for eight straight months and recently hit a brand new all-time record high of 13 percent;
- The number of mortgage applications in Spain has fallen by 90 percent since the peak of the housing boom;
- The unemployment rate in France has risen for 9 quarters in a row and recently soared to a new 16 year high;
- Deutsche Bank, probably the most important bank in Germany, is the most highly leveraged bank in Europe (60 to 1) and it has approximately 70 trillion dollars worth of exposure to derivatives;

The conclusion that the data arise after the leave for themselves. Anyone who reads this entry should think about whether the eurozone has a chance survive?

So as bad as things are right now, the truth is that this is nothing compared to what is coming.

regards,
oscarjp

The information contained in this publication is not intended as an offer or solicitation for the purchase or sale of any financial instrument. Any opinion offered herein reflects oscarjp-chrimatistikos current judgment and may change without notice. Users acknowledge and agree to the fact that, by its very nature, any investment in shares, stock options and similar and assimilated products is characterised by a certain degree of uncertainty and that, consequently, any investment of this nature involves risks for which the user is solely responsible and liable.

Thursday 9 January 2014

What's important, we heard today by Mario Draghi?

hello,

After the conference, the President of the ECB may feel a slight hunger. Draghi referred to the most important issues, but clearly not enough. Did not rule out any option, but did not say anything specific. The prospect of easing according to Morgan Stanley and Credit Agricole believe that today's softening of the language is the next step towards loosening, the introduction of the LTRO.

Was dominated questions about inflation, which in December was very low, especially core CPI. Draghi noted, however, that this is due in part to changes basket in Germany, which was expected, and that the path of inflation is not surprising ECB, and only in such case, the Bank will work. In this issue therefore remains to wait for the development of the situation and subsequent readings of inflation, especially in southern Europe, where the threat of deflation is very real.

The most important issue was contrary to appearances, not inflation, but the money market. As a result of stress stress that the ECB is about to carry out European banks repay earlier LTRO, which resulted in December, an increase in short-term interest rates, which means the monetary tightening. Currently, these rates fell slightly, but are still higher than in the preceding period. Draghi noted the problem, which is important, but still lacks clarity. President stated that the ECB will act if the situation deteriorates, but did not specify how to understand the deterioration of the situation (which interest, for how long and how much would have to be increased), nor what means in such a situation will use the Bank.

An important fact is that at the moment it will be hard for an increase in interest rates on the interbank market in the euro area. Which in turn will favor the dollar.

Regarding my trade <here> dated December 22 I decided to lower the stop loss to 1.3650 level.

regards,
oscarjp

Tuesday 7 January 2014

US Trade Balance - what does it mean for the U.S. dollar ?

hello,

Today we met about the trade balance figures for November, which proved to be better than expected.

The deficit was 34.3 billion USD, much less than the consensus (40.2 billion USD). <more info> But what is important, lower deficit was achieved with an increase in exports. Conclusions are two, and both positive for the dollar:

1. exports increased in the period October-November by 3%, while at the same time, imports fell by 1.3%. That means a major contribution of net exports to economic growth in the fourth quarter,

2. annual growth rate of exports for the second month in a row remained above 5%. The last time such a situation occurred in March 2012. For comparison, the annual growth of German exports is less than 1% (data for October).

A visual summary from Bloomberg:

chart 1. US Trade Monitor, 2014-01-07

Trade with some key trading partners:

1. The goods deficit with China decreased from $28.9 billion in October to $26.9 billion in November. Exports increased $0.1 billion (primarily soybeans and corn) to $13.2 billion, while imports decreased $1.8 billion (primarily toys, games, and sporting goods and apparel) to $40.1 billion.

2. The goods deficit with the European Union decreased from $14.3 billion in October to $10.1 billion in November. Exports decreased $0.2 billion (primarily artwork, antiques, stamps, etc. and organic chemicals) to $22.9 billion, while imports decreased $4.4 billion (primarily pharmaceutical preparations) to $33.0 billion.

3. The goods deficit with Canada decreased from $2.8 billion in October to $1.5 billion in November. Exports decreased $1.3 billion (primarily petroleum products and automobiles) to $25.7 billion, while imports decreased $2.7 billion (primarily crude oil) to $27.1 billion.


Breaking down the goods trade by category:

1. The October to November increase in exports of goods reflected increases in industrial supplies and materials ($0.7 billion); other goods ($0.5 billion); capital goods ($0.3 billion); and automotive vehicles, parts, and engines ($0.1 billion). Decreases occurred in consumer goods ($0.5 billion) and foods, feeds, and beverages ($0.1 billion).

2. The October to November decrease in imports of goods reflected decreases in industrial supplies and materials ($4.3 billion); other goods ($0.8 billion); foods, feeds, and beverages ($0.3 billion); and consumer goods ($0.1 billion). Increases occurred in automotive vehicles, parts, and engines ($1.1 billion) and capital goods ($0.9 billion).

3. The November 2012 to November 2013 increase in exports of goods reflected increases in industrial supplies and materials ($3.1 billion); capital goods ($1.2 billion); foods, feeds, and beverages ($1.1 billion); automotive vehicles, parts, and engines ($0.8 billion); other goods ($0.6 billion); and consumer goods ($0.5 billion).

4. The November 2012 to November 2013 decrease in imports of goods reflected decreases in industrial supplies and materials ($6.9 billion); other goods ($0.3 billion); and consumer goods ($0.3 billion). Increases occurred in capital goods ($2.2 billion); automotive vehicles, parts, and engines ($1.6 billion); and foods, feeds, and beverages ($0.2 billion)


Tomorrow is going to happen :)

Tomorrow we have two important events: the publication of the report ADP (prelude to government data, which will be announced on Friday) and minutes of the FOMC meeting - is one of the three key events of the week.
In addition, we will get data about industrial orders in Germany, and now the morning data about the trade balance of Germany and France, which will show how effectively the eurozone recovery scenario materializes.
Thursday is the central banks: BoE and ECB. Regarding ECB: Inflation in EMU is alarmingly low, although the data show a slight improvement in the economic situation plus we have obviously conference Draghi.
Friday is the culmination: the monthly report from the labor market. In short, the data is likely to decide whether, in January FOMC will reduce QE by a further 10 billion USD.


best regards,
oscarjp

Monday 6 January 2014

EUR/USD what next ?

hello,

My previous entries regarding EUR/USD where you can find a lot of interesting things. This can be a good introduction to this entry.

<EUR/USD>

The market interest rate does not change much at the end of the week, when it comes to USD:

The rates for the dollar basically consolidating FRA 9×12 or a minimum increase FRA 18×24. For the euro, I see no change in the medium-term contracts FRA 9×12 and FRA 18×24, but on the short end you will see a normalization of the liquidity situation, although it is quite slow (which on the other hand means that there is still potential for revaluation of euro). Monthly LIBOR in euro is now less than 0.2%, although it is still almost 3bps above interest rate for a dollar.

chart 1. EUR/USD & spread FRA EU-US 3x6

chart 2. EUR/USD & spread FRA EU-US 6x9

chart 3. EUR/USD & spread FRA EU-US 9x12
chart 4. EUR/USD & spread FRA EU-US 12x15

chart 5. EUR/USD & spread FRA EU-US 12x18

Importantly, the gap in the charts shown above is still very high and should lead to further falls in EURUSD.

The next week, emotions do not run out

US - all, of course, waiting for the first of the new year Payroll (Friday, 14:30), except that on Monday we will know the ISM service sector, on Tuesday foreign trade figures, on Wednesday - the ADP report and the minutes of the FOMC meeting, on Thursday the traditionally weekly claims.

ECB meeting - it will be the most important event in the euro zone in the next week, we'll see if Draghi on Thursday, the president will address the recent strong changes in the market interest rate, which has translated well on EURUSD

UK - also promises to be an interesting week on the pound - meeting of the Bank of England and the publication of the balance of trade on Thursday, on a Friday we will get data regarding industrial production in the UK


regards,
oscarjp

The information contained in this publication is not intended as an offer or solicitation for the purchase or sale of any financial instrument. Any opinion offered herein reflects oscarjp-chrimatistikos current judgment and may change without notice. Users acknowledge and agree to the fact that, by its very nature, any investment in shares, stock options and similar and assimilated products is characterised by a certain degree of uncertainty and that, consequently, any investment of this nature involves risks for which the user is solely responsible and liable.

Saturday 4 January 2014

difficult task for fWIG20 Index

good morning,

It seems that we are experiencing a correction in the Index of the largest companies quoted on the Warsaw Stock Exchange. 

As I showed and warned in an entry dated November 17 <chart 1> regarding the possibility start of the correction with the maximum levels with the end a growth wave <chart 2>. Then, I recommended them short positions at 2600-2615. At this time, profit is already 200 points using only a single futures contract.

chart 1. fWIG20 Index Daily, published: 2013-11-17


chart 2. fWIG20 Index Daily, published: 2013-12-13

After completing 5 waves shown in chart 3, from 18 December, the financial market is trying to achieve correction. Unfortunately, at the moment it looks like a "tilting at windmills". With the weak sentiment in other financial markets, the Polish market will be hard to reach the levels indicated by me where potentially should end correction. It's hard also at this time, the formation may have read this correction.

chart 3. fWIG20 Index H1, 2013-01-04

There is also a high probability that the correction already ended and now it is possible continuation of the falls to the levels of 2300 points.

My recommendation: "short position" with Stop Loss in 2492 points.

trade safe,
oscarjp,

The information contained in this publication is not intended as an offer or solicitation for the purchase or sale of any financial instrument. Any opinion offered herein reflects oscarjp-chrimatistikos current judgment and may change without notice. Users acknowledge and agree to the fact that, by its very nature, any investment in shares, stock options and similar and assimilated products is characterised by a certain degree of uncertainty and that, consequently, any investment of this nature involves risks for which the user is solely responsible and liable.

Thursday 2 January 2014

BUND - 10Y Ger Govt Bond - 2 scenarios

hello,

Currently, on the chart showing the contract for the 10Y German's treasury bond. You can see two scenarios <chart 1 and chart 2>, taking into consideration only technical analysis, can be concluded that both scenarios are practicable.

chart 1. Bund Daily, first scenario

chart 2. Bund Daily, second scenario

It seems to me that an important level to achieve, one of the scenarios is the level between 140.58 and 140.84 as shown on the two charts.

If you are brave, write which scenarios you think is more possible and why.

I want try, and I'll invest little money and buy a short position with a stop loss at 141.30 and target below 136.44


regards,
oscarjp

The information contained in this publication is not intended as an offer or solicitation for the purchase or sale of any financial instrument. Any opinion offered herein reflects oscarjp-chrimatistikos current judgment and may change without notice. Users acknowledge and agree to the fact that, by its very nature, any investment in shares, stock options and similar and assimilated products is characterised by a certain degree of uncertainty and that, consequently, any investment of this nature involves risks for which the user is solely responsible and liable.

Wednesday 1 January 2014

15. Summary of the trades (December 16th, 2013 - December 31st, 2013)

hello,

Happy new year !!!, let the meet all of your dreams :)

It's a New Year, a new personal New Year's resolutions, and certainly new plans to achieve regarding your own investment portfolio. I hope that my analysis and my point of view the current situation in the financial markets will largely achieve your own investment plans. I wanted to thank you for all the questions and requests addressed to me. Thanks also for the fact that you visit my blog and that you are interested in what is my opinion.

In the past two weeks due to Christmas holiday there are only two analyzes.


From what I noticed, unfortunately, did not give in analyzes of stop-loss levels. What it extremely difficult for a complete look at the chart. In addition, during the Christmas holidays on EUR/USD recorded a high volatility due to the very low liquidity. Due to the fact that all the investment banks and financial institutions were closed most of the technical analysis and stop-loss levels would be affected.

Update of EUR/USD

The interest rate market shows the reaction, which was to be expected after the reducing QE - fundamental change of interest rates in favor of the U.S. dollar. The chart number 1 shows that the difference in the rates of the contract FRA 9×12 changed from +5 bps in favor of the euro in the first half of December to -6.5 bps (in favor of the dollar) now! It's a huge change, indicating that the rate could go back up to 7 figures!

chart 1. spread between EUR/USD & FRA 9x12

Therefore, I still think that in the next few days we should observe the strengthening of the dollar. A situation that took place during the holiday season, I think that was caused by low liquidity.


Summary of trades

best regards,
oscarjp

The information contained in this publication is not intended as an offer or solicitation for the purchase or sale of any financial instrument. Any opinion offered herein reflects oscarjp-chrimatistikos current judgment and may change without notice. Users acknowledge and agree to the fact that, by its very nature, any investment in shares, stock options and similar and assimilated products is characterised by a certain degree of uncertainty and that, consequently, any investment of this nature involves risks for which the user is solely responsible and liable.