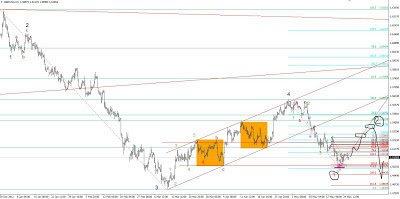
On Wednesday, there were two strong signals the start of the correction on GBP / USD.
the first of which was an increase of volume in the important resistance which meant the appearance of "smart money" in the market - chart 1
and a second signal confirmed Elliott waves - chart 2
 |
| chart 1 - GBP/USD, H1 |
 |
| chart 2 - GBP/USD, H1 |
basic question now is - what formation in the correction we will draw and what will be price range.
If we look more broadly at the graph it can be assumed that this is just the first wave, and now creates a corrective wave number 2. After which there will be the best time to make money.
maximum range of correction it levels of 5380, but heavy resistance are also in 5310 (chart 3). At these price levels should pay attention to the volumen.
 |
| chart 3 - GBP/USD, H4 |
regards,
oscarjp
The information contained in this publication is not intended as an offer or solicitation for the purchase or sale of any financial instrument. Any opinion offered herein reflects oscarjp-chrimatistikos current judgment and may change without notice. Users acknowledge and agree to the fact that, by its very nature, any investment in shares, stock options and similar and assimilated products is characterised by a certain degree of uncertainty and that, consequently, any investment of this nature involves risks for which the user is solely responsible and liable.
No comments:
Post a Comment